Add a station to the operator dashboard
Note
The station must be Online and Running to start a data collection.
Each sampling plan must be defined within the product/process template. For more information, go to Define a new sampling plan. Specify the data collection methods and data sources at the appropriate station. For more information, go to Example of specifying data sources for a sampling plan.
Enter data manually to a standard collection form
-
Select
Start Collection
from the station on the operator dashboard.
Note
If you use a Connect data table as your data source, Real-Time SPCTM retrieves the latest subgroup from the Connect data table and populates the data collection form for that measure or descriptor.
- Enter subgroup descriptors first. If you have subgroup descriptors, you enter one value that applies to the entire subgroup.
-
Select whether to enter data down each column or across each row.
- Select By Row to enter data by sample. Thus, enter the first observation for each variable before entering the second observation.
- Select By Column to enter data by measure. Thus, enter all the observations for the first variable before entering observations for the next variable.
- Enter individual descriptors for each measurement in the subgroup.
-
Enter the observations in the respective columns. All measures are first,
then grouped defects and defectives.
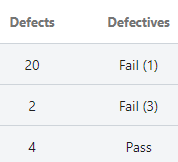
The individual defective columns contain Pass or Fail, according to the specific defective measure. The column of grouped defectives indicates Pass or Fail for each unit. If a unit fails, the number in parenthesis indicates the number of reasons for failing. For instance, Fail (3) means that the unit is defective and contains 3 of the defective types.
-
Use the following buttons to advance through the data collection
sheet.
- Select Skip to skip an observation.
- Select Previous to edit the previous observation.
- Select Next to advance to the next cell.
- Select Finish now to complete the data collection.
-
Select
Add Row
to add another row to the data collection form, if necessary.
Note
A measure that creates an I-MR chart can have only one observation.
- When the collection is complete, save and exit, or cancel and exit.
Note
You can change the order of the descriptors or measures in your sampling plan. For more information go to Set data collection order.
Enter data manually to a check sheet
- Select Start Collection from the station on the operator dashboard.
- Enter subgroup descriptors first, if you have them.
- Answer each question by selecting a Pass/Fail option. You can customize these labels during setup.
- When the collection is complete, select OK to submit.
Note
You can change the order of the descriptors or questions in your sampling plan. For more information go to Set data collection order.