When to use calculated measures
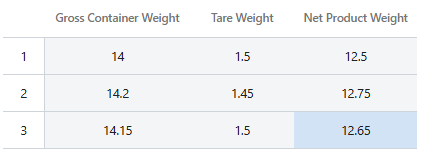
Calculated measures are commonly used for convenience and consistency. For example, if a process includes measures for gross container weight and tare weight, you can create a calculated measure to automatically determine the net product weight.
Calculated measures are ideal when the value should update automatically whenever the source data changes.
Add a calculated measure to a process
Calculated measures are always associated with a specific process. To add a calculated measure to a process, open the process template.
- In the Measures section, select Add Calculated Measure.
- Enter a name and an optional description.
- Enter a valid equation.
- Equation variables must already exist as process, output, or calculated measures.
- Variable names must use the following format, with an underscore at
the beginning and end of the name,
_VariableName1_. - Select Show Variables to view available measures.
- Select OK, then save your changes.
For more information on process and output measures, go to Continuous measures.
Valid equations
Real-Time SPC supports basic mathematical operators and functions. Equations must follow the standard order of operations (PEMDAS). Parentheses are required for functions, exponents, and grouped operations.
| Syntax | Use |
|---|---|
| `abs(number)` | Returns the absolute value of a number |
| `add(number1, number2, ...)` | Adds multiple numbers together |
| `divide(number1, number2, ...)` | Divides numbers sequentially |
| `max(number1, number2, ...)` | Returns the maximum value |
| `mean(number1, number2, ...)` | Calculates the average |
| `min(number1, number2, ...)` | Returns the minimum value |
| `multiply(number1, number2, ...)` | Multiplies multiple numbers |
| `round(number1, decimalnumber)` | Rounds the number1 to number2 decimal places |
| `sqrt(number)` | Returns the square root |
| `std(number1, number2, ...)` | Calculates the standard deviation |
| `subtract(number1, number2, ...)` | Subtracts numbers sequentially |
- Calculate net weight
- Subtract tare weight from gross weight.
subtract(_Gross Container
                                            Weight_,_Tare Weight_)
_Gross Container Weight_ - _Tare Weight__Gross Container Weight_ - 1.5
- Calculate area
- Multiply length and width.
multiply(_Length_,_Width_)_Length_ * _Width_
- Calculate the mean of several measures
mean(_Measure1_,_Measure2_,_Measure3_,_Measure4_)- Calculate the standard deviation of several measures
std(_Measure1_,_Measure2_,_Measure3_,_Measure4_)
Note
Only valid measures associated with the same process as the calculated measure are available for use in equations.
Deleted equation variables
If the equation for a calculated measure contains a deleted measure, the equation is
no longer valid. The equation remains; however, the deleted measure is represented
by a system id value. For example, the following valid equation, _Gross Container Weight_ - _Tare Weight_, becomes
invalid when _Tare Weight_ is deleted from the
process.
The invalid equation contains a system ID value instead of a valid measure name
(_Gross Container Weight_ - _12_).
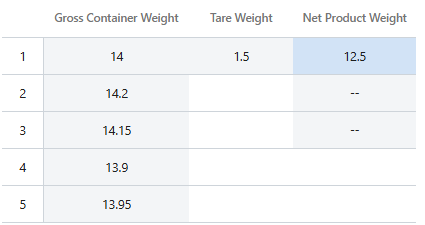
Real-Time SPC retains all previous calculations. Subsequent data collections will use a null value until the equation is valid again.
Sampling considerations
- All measures used in a calculated measure must be in the same sampling plan as the calculated measure.
- The subgroup size for the calculated measure does not have to match the subgroup sizes for the variables in the defining equation.
- Calculations are based on the smallest subgroup size among the measures used.
Example
Edit observations
You cannot edit calculated measures directly. Instead, edit one of the measures used in the equation.
- Calculated measure values
- Plotted points of the control chart
- Tests for special causes
- Summary and performance statistics
Note
If the original calculated data point was flagged and had assignable causes and/or corrective actions, these will remain if the point still exceeds the limits. If the point no longer exceeds the limits, the flag is removed; however, the assignable causes and correctives remain.