Minitab Model
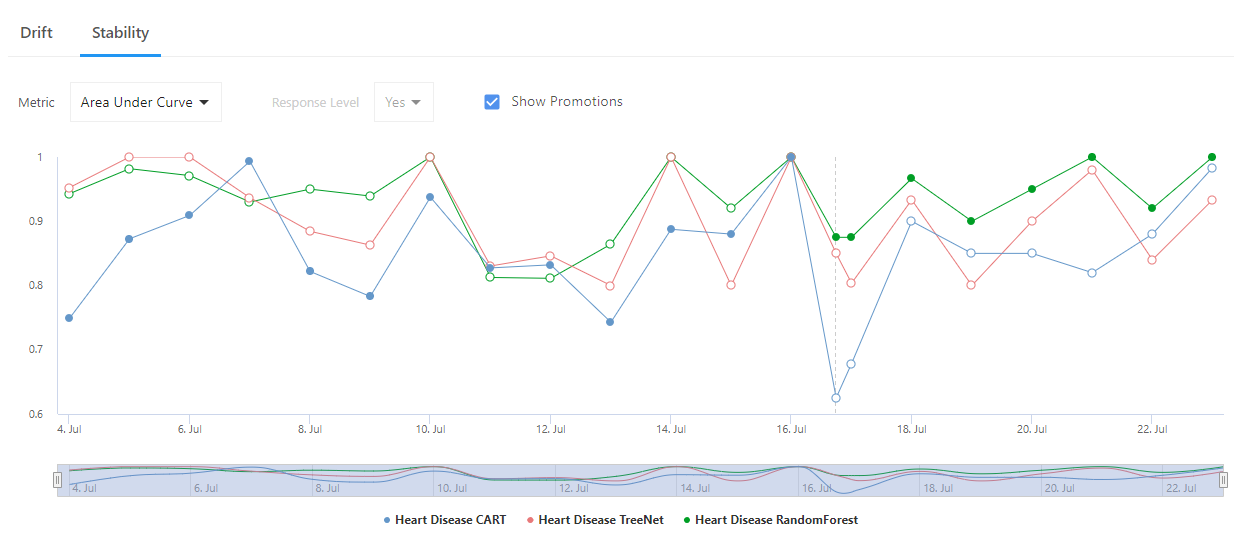
Ops displays the Stability report for the deployed
champion model and the competing challengers on the Performance tab. Stability reports update daily.
When a deployment is paused, stability data are not logged. Stability data are logged
only if a matching correlation id was found within the last 6 months. For
information on uploading data and data requirements, go to the following topics.
Once you have stability data for your model, you can select the production period and
date range for your report.
The Random Forest model was promoted on July 16.
Measures of performance for models with categorical response variables
Classification Accuracy
The classification accuracy indicates how often the model accurately
classifies the events. Larger values indicate better
performance.
AUC
The values for the area under the ROC curve usually range from 0.5 to 1.
Larger values indicate a better classification model. When the model can
perfectly separate the classes, then the area under the curve is 1. When
the model cannot separate the classes better than a random assignment,
then the area under the curve is 0.5.
For a multinomial response, the AUC is set to 0 under the following
conditions.
If a class is missing
from the actual values, then the AUC for that class is 0. For
example, if a model includes the classes 1 to 5 but the
stability data do not include any actual values of 4, then the
AUC for 4 is 0.
If every actual value
has the same class, then the AUC for all classes is 0. For
example, if a model includes the classes 1 to 5 but the actual
values are all 2, then the AUC is 0 for all classes.
Average Predicted Probability and Proportion of Event Cases
This graph displays either the average predicted probability of an event
or the proportion of cases classified as an event over time.
When the production data period is daily, the plotted points are
daily averages.
When the production data period is weekly, the plotted points
are weekly averages.
When the production data period is monthly, the plotted points
are monthly averages.
Measures of performance for models with continuous response
variables
R-squared
The higher the R2 value, the better the model fits your data.
MAD
The mean absolute deviation (MAD) expresses accuracy in the same units
as the data, which helps conceptualize the amount of
error. Outliers have less of an effect on MAD than on
R2. Smaller values indicate a better fit.
Average Predicted Response
This graph displays the average predicted response over time.
When the production data period is daily, the plotted points are
daily averages.
When the production data period is weekly, the plotted points
are weekly averages.
When the production data period is monthly, the plotted points
are monthly averages.
Examine stability reports
The tutorial has examples of stability reports. To see these examples, go to Examine stability reports.