Examine drift reports
Drift measures the similarity between your baseline data and the production data. Use differences between the baseline data and the production data to determine when to try to improve the champion model. On the drift report, the production data represent the data that have scores during the deployment.
Note
Drift reporting is only available for champion models.
Drift report with baseline data
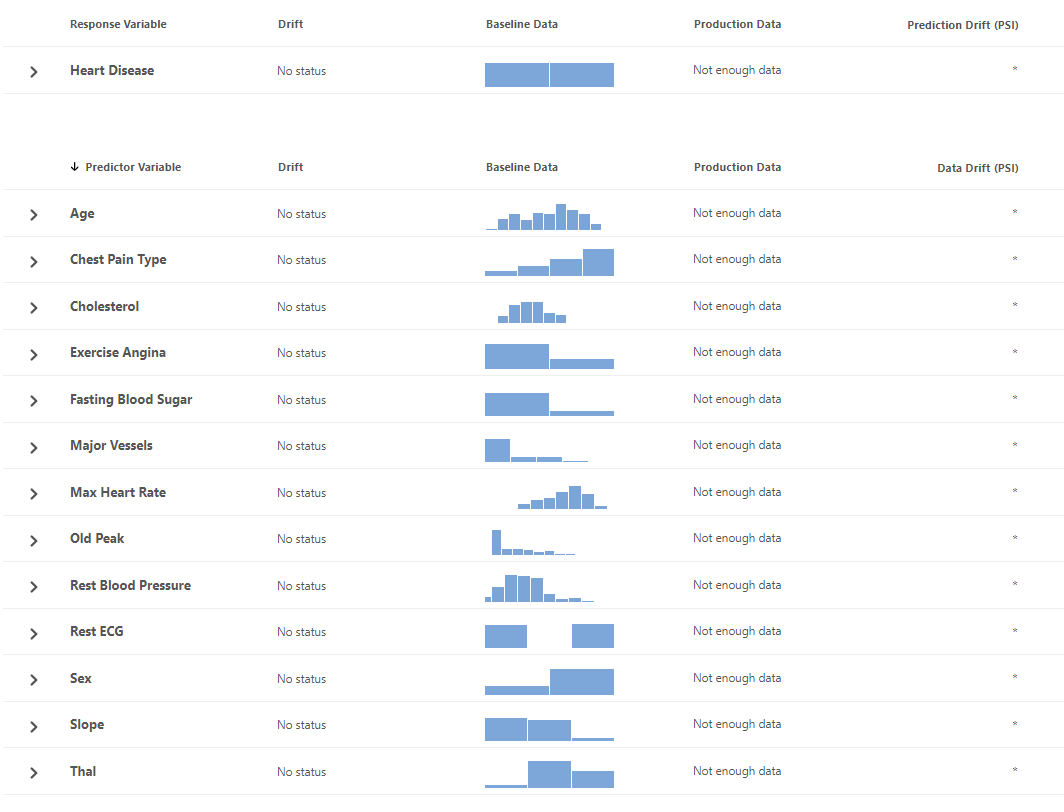
The Drift report shows the baseline data for your champion model. Once you score this model and have predictions, the Drift report will also show the production data.
Example of minimal drift
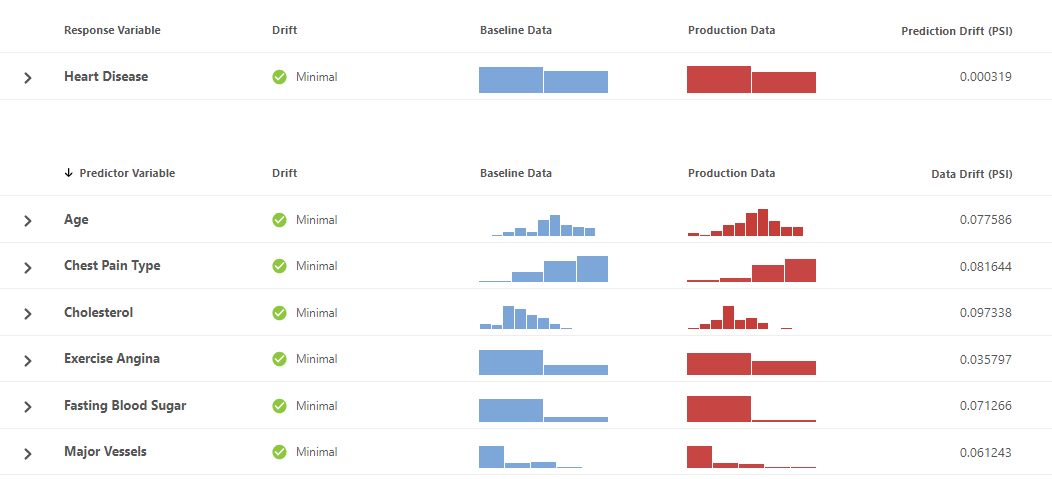
The response and all the predictors exhibit minimal drift. This means that the baseline data and the production data are similar.
Example of severe and moderate drift
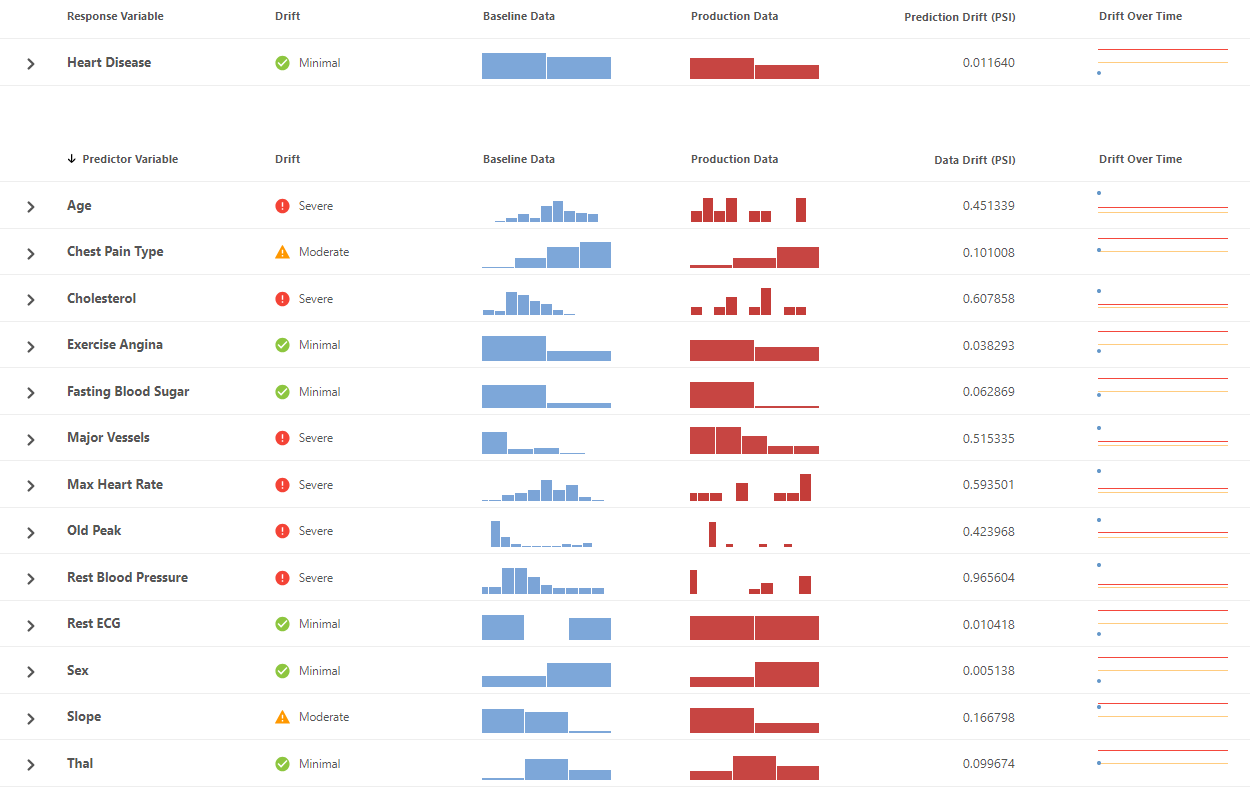
Several predictors exhibit severe and moderate drift. This means that the training data may no longer represent the current production data for these variables. You may want to consider uploading new baseline data.
Examine stability reports
The stability report shows model performance over time. For classification models, the stability report displays Classification Accuracy and Area Under the ROC Curve (AUC). For regression models, the stability report displays R-squared and Mean Absolute Deviation (MAD).
If the performance of the model decreases, investigate whether to retrain or replace the model.
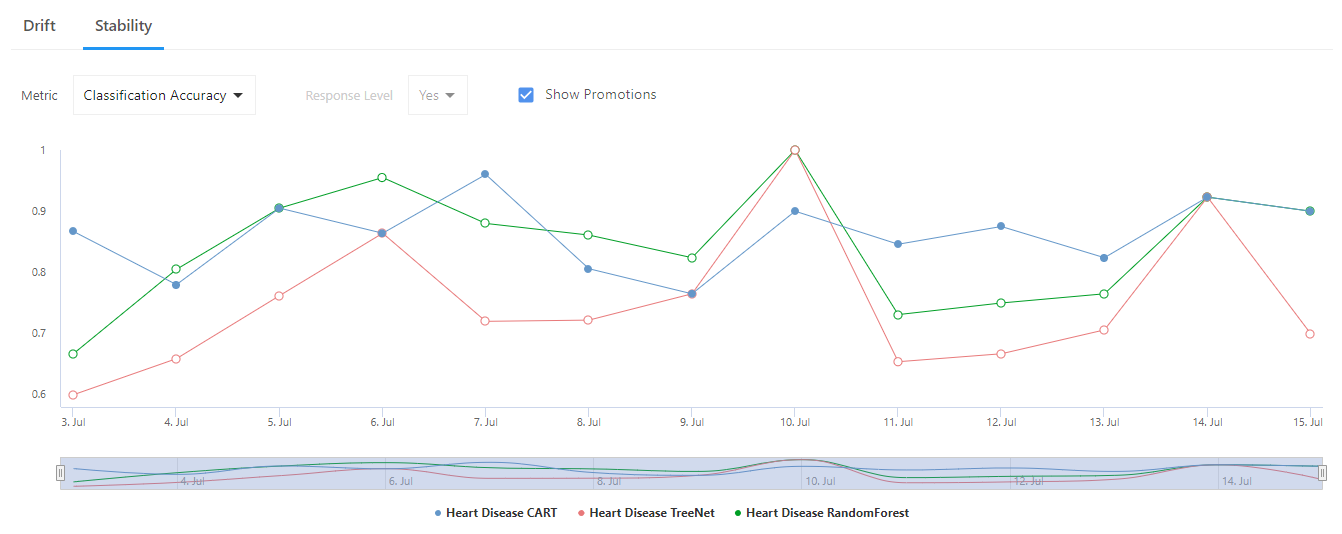
For example, analysts want a model to have an AUC of at least 0.85. The stability report shows that the AUC has been fluctuating over time.