Minitab Model
Ops displays the Drift report for the deployed
champion model on the Performance tab.
When a deployment is paused, you can upload baseline data, but not production data.
You must have at least ten observations of baseline data to generate a chart of
baseline data and at least ten observations of production data to generate a chart
of production data. For information on uploading data and data requirements, go to
the following topics.
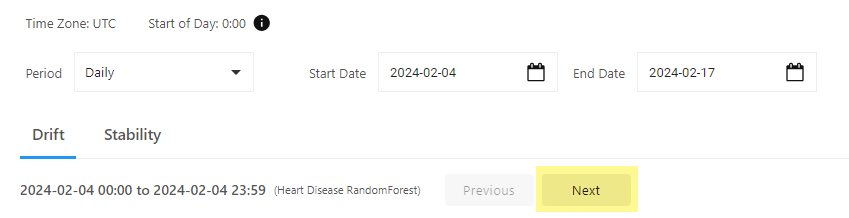
Once you have baseline and production data for your model, you can select the
production period and date range for your report. The predictors are sorted by relative variable
importance.
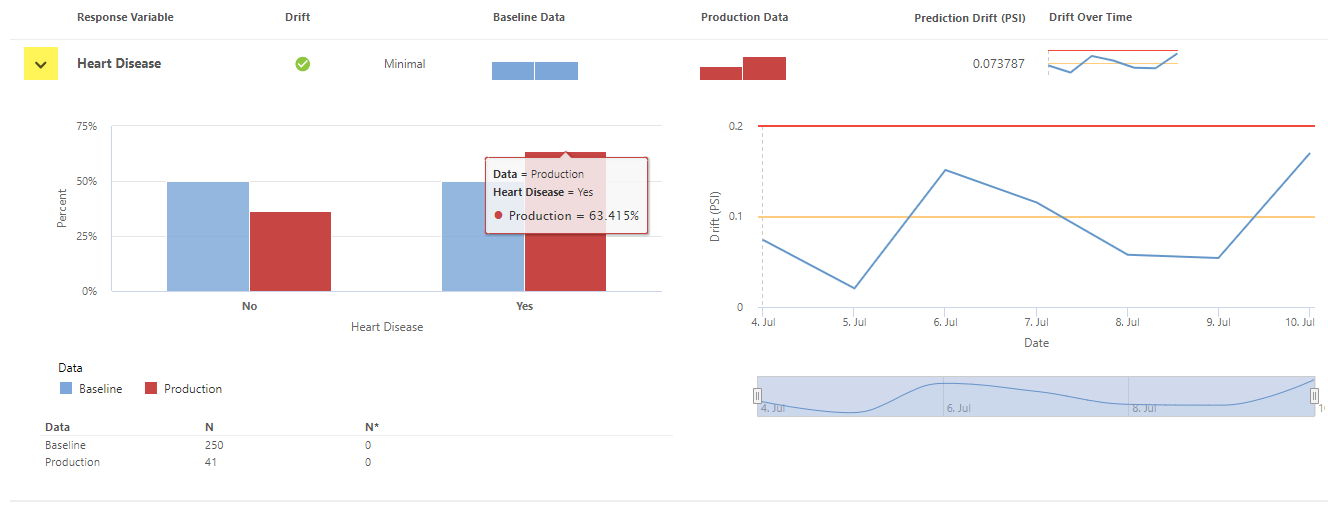
You can open the expander for each variable to view more information.
Note
The Drift Over Time plot will not display historical data
for a variable when the variable is no longer in the deployment.
Types of model drift
Drift measures the similarity between your baseline data and the production data.
Use differences between the baseline data and the production data to determine when
to try to improve your model. Minitab Model
Ops reports prediction drift and data
drift.
Prediction drift
This type of drift represents a drift in the model's predictions over
time. When this drift is substantial, you may want to retrain the model
with additional data or replace the model.
Data drift
This type of drift represents a change in the distribution of the input
variables. When this drift is substantial, you may want to retrain the
model with additional data.
If there is enough production data to determine the drift status, the drift status is
minimal, moderate, or severe, according to the definitions in the Settings tab.
Examine drift reports
The tutorial has examples of drift reports with baseline data only, minimal drift,
and moderate and severe drift. To see these examples, go to Examine drift reports.