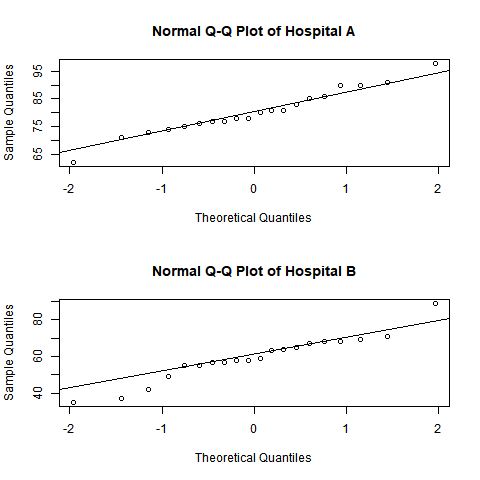
A healthcare consultant wants to compare the normality of patient satisfaction ratings from two hospitals using a quantile-quantile (QQ) plot. QQ plots show how well each set of patient satisfaction ratings fit a normal distribution.
The example R script reads the data from columns in Minitab. The script calculates the quantiles and creates a QQ plot for each column. Then the script sends the plots to the Minitab Output pane.
All the files referenced in this guide are available in this .ZIP file: r_guide_files.zip.
Use the following files to perform the steps in this section:
| File | Description |
|---|---|
| qq_plot.R | An R script that takes columns from a Minitab worksheet and displays the QQ Plot for each column. |
The
R script in the below example
requires the following R packages:
- mtbr
- The R package that integrates Minitab and R. In the example, functions from this module send R results to Minitab.
- Ensure you have installed the required modules: mtbr.
- For information on how to install Minitab's R package, go to Step 2: Install mtbr.
- Save the R script file, qq_plot.R, to your Minitab default file location. For more information on where Minitab looks for R script files, go to Default folders for R files for Minitab.
- Open the sample data set HospitalComparisonUnstacked.MWX.
-
In the Minitab
Command
Line pane, enter
RSCR "qq_plot.R" "Hospital A" "Hospital B". - Click Run.
qq_plot.R
library(mtbr)

column_names <- commandArgs(trailingOnly = TRUE)

if (length(column_names) == 0) {
  current_index <- 1
  while (length(mtb_get_column(paste0("C",current_index))) > 0) {
    column_names[current_index] <- paste0("C", current_index)
    current_index <- current_index + 1
  }
}

if (length(column_names) == 0 || length(mtb_get_column(column_names[1])) == 0) {
  stop("Worksheet is empty or column data could not be found!\n\tPass columns to RSCR or move first column to C1.")
}

png("qqplot.png")
par(mfrow=c(ceiling(length(column_names)/round(sqrt(length(column_names)))), round(sqrt(length(column_names)))))
for (column_name in column_names) {
  column <- mtb_get_column(column_name)
  qqnorm(column, main=paste0("Normal Q-Q Plot of ", column_name))
  qqline(column)
}
graphics.off()
mtb_add_image("qqplot.png")
Results
R Script