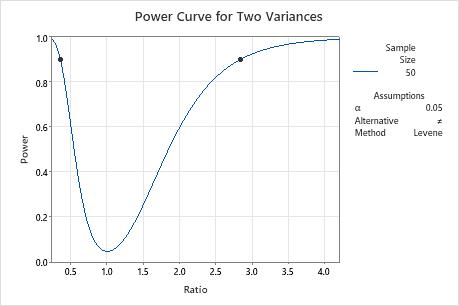
For example, the manager of a car manufacturer wants to compare variances for the diameters of camshafts for two different vendors. Before collecting the data for a 2 variances test, the manager uses a power and sample size calculation to determine the ratio they can detect when the size of both samples is 50 and the power is 0.9.
- Choose .
- From the drop down, choose Enter ratios of variances.
- In Sample sizes, enter 50.
- In Power values, enter 0.9.
- Click OK.
Interpret the results
With a sample size of 50 and a power of 0.9, the test can detect a ratio of approximately 2.8 or 0.35. A ratio close to 1 suggests equality between the two standard deviations or variances. A ratio greater than 1 suggests the variance or standard deviation of the first group is higher than the second group. A ratio less than one suggests the variance or standard deviation of the first group is lower than the second group. The manager wants to be able to detect ratios that are closer to 1 than 2.8 or 0.35, so the manager decides to collect a larger sample size.
Results
| Sample Size | Power | Ratio |
|---|---|---|
| 50 | 0.9 | 2.83320 |
| 50 | 0.9 | 0.35296 |

