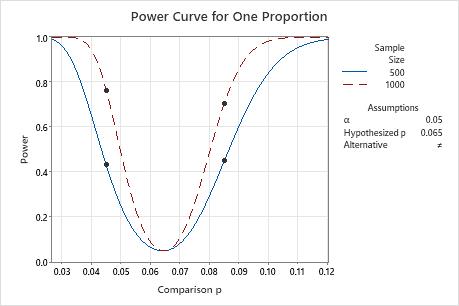
A marketing analyst wants to determine whether mailed advertisements that were sent to a random sample of households result in a response rate that is different from the national average of 6.5% (target value). Before collecting the data for a 1 proportion test, the analyst uses a power and sample size calculation. The analyst wants to determine what the power of the test will be when the sample size is either 500 or 1000 and the test can detect a comparison proportion of 4.5% and 8.5%.
- Choose .
- In Sample sizes, enter 500 1000.
- In Comparison proportions, enter 0.045 0.085.
- In Hypothesized proportion, enter 0.065.
- Click OK.
Interpret the results
With a sample size of 500, the test will have a power of 0.431 and 0.449 to detect a comparison proportion of 0.045 and 0.085. With a sample size of 1,000, the test would have a power of 0.764 and 0.704 to detect a comparison proportion of 0.045 and 0.085. The analyst decides that 0.764 is not enough power, and collects a sample size larger than 1,000.
Results
| Comparison p | Sample Size | Power |
|---|---|---|
| 0.045 | 500 | 0.431131 |
| 0.045 | 1000 | 0.764259 |
| 0.085 | 500 | 0.449114 |
| 0.085 | 1000 | 0.703796 |

