Use Pairwise
Slopes to calculate the slopes between two columns when each row represents a coordinate
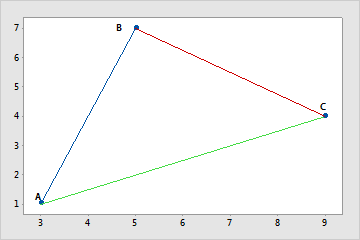
point on the X-Y plane. For example, the following data contain three coordinate points,
which are shown on the scatterplot: (3, 1), (5, 7), and (9, 4). The pairwise slopes for
these data are the slopes of the straight lines between each pair of coordinates.
X
Y
Point A
3
1
Point B
5
7
Point C
9
4
Slope AB = (7 – 1) / (5 – 3)
= 3
Slope AC = (4 – 1) / (9 – 3)
= 1/2
Slope BC = (4 – 7) / (9 – 5)
= −3/4
Where to find this analysis
To perform pairwise slopes, choose Stat > Nonparametrics > Pairwise Slopes.
When to use an alternate analysis
To calculate the means between pairs of values, use Pairwise
Averages.