A quality engineer at a consumer healthcare company wants to determine whether their generic antacid is equivalent to a name-brand antacid. Two groups of participants receive a 5-day course of one antacid, followed by a 2-week washout period, and then a 5-day course of the other antacid. Group 1 receives the generic antacid (the test treatment) followed by the name-brand antacid (the reference treatment). Group 2 receives the name-brand antacid followed by the generic antacid. The engineer measures the gastric pH on the last day of each treatment. Because lower pH values are more acidic, higher values mean the drug is more effective. The engineer will consider the antacids equivalent if the test pH is within 10% of the reference pH.
The engineer performs an equivalence test for a 2x2 crossover design to determine whether the test pH is within 10% of the reference pH.
- Open the sample data, StomachAcid.MWX.
- Choose .
- From the drop-down list, select Data for two sequences are unstacked.
- From Treatment order for sequence 1, select Test, Reference.
- In Sequence 1, Period 1, enter Group 1, Generic. In Sequence 1, Period 2, enter Group 1, Brand.
- In Sequence 2, Period 1, enter Group 2, Brand. In Sequence 2, Period 2, enter Group 2, Generic.
- From Hypothesis about, select Test mean - reference mean.
- From What do you want to determine? (Alternative hypothesis), select Lower limit < test mean - reference mean < upper limit.
- In Lower limit, enter –0.1.
- In Upper limit, enter 0.1.
- Select Multiply by reference mean.
- Click Options.
- In Label for reference treatment, type Brand. In Label for test treatment, type Generic.
- Click OK in each dialog box.
Interpret the results
Important
If either the carryover effect or the period effect is significant, then the results of the equivalence test may not be reliable.
The p-value for the carryover effect (0.498) and the p-value for the period effect (0.128) are both greater than 0.05. Thus, these effects are not significant at the 0.05 level.
The p-value for the treatment effect (0.000) is less than 0.05. Thus the treatment effect is significant at the 0.05 level. The significant treatment effect indicates that one antacid is better than the other at raising gastric pH. The generic antacid did not raise gastric pH as much as the brand-name antacid. The mean gastric pH after using the generic antacid was approximately 0.321 less than the mean pH after using the brand-name antacid.
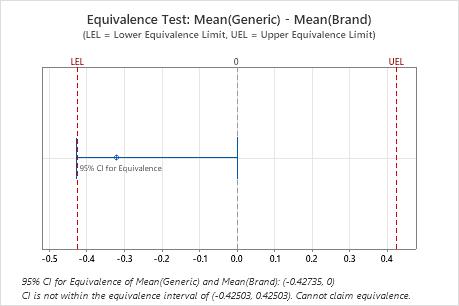
The confidence interval for equivalence (−0.42735, 0) falls partly outside of the equivalence interval (−0.42503, 0.42503). Thus, the engineer cannot claim that the two antacids are equally effective at reducing stomach acid.
Method
Treatment order for subjects in sequence 2: Brand, Generic
Lower equivalence limit = -0.1 × sample reference mean = -0.42503
Upper equivalence limit = 0.1 × sample reference mean = 0.42503
Descriptive Statistics
| Period 1 | Period 2 | ||||
|---|---|---|---|---|---|
| Sequence | N | Mean | StDev | Mean | StDev |
| 1 | 9 | 4.0911 | 0.68641 | 4.3144 | 0.63677 |
| 2 | 8 | 4.1862 | 0.74110 | 3.7675 | 0.65741 |
Effects
| Effect | SE | DF | T-Value | P-Value | 95% CI for Equivalence | |
|---|---|---|---|---|---|---|
| Carryover | 0.45181 | 0.64988 | 15 | 0.69521 | 0.498 | (-0.93339, 1.8370) |
| Treatment | -0.32104 | 0.060641 | 15 | -5.2941 | 0.000 | (-0.45030, -0.19179) |
| Period | -0.097708 | 0.060641 | 15 | -1.6112 | 0.128 | (-0.22696, 0.031546) |
Difference: Mean(Generic) - Mean(Brand)
| Difference | SE | 95% CI for Equivalence | Equivalence Interval |
|---|---|---|---|
| -0.32104 | 0.060641 | (-0.427349, 0) | (-0.425035, 0.425035) |
Test
| Null hypothesis: | Difference ≤ -0.42503 or Difference ≥ 0.42503 |
|---|---|
| Alternative hypothesis: | -0.42503 < Difference < 0.42503 |
| α level: | 0.05 |
| Null Hypothesis | DF | T-Value | P-Value |
|---|---|---|---|
| Difference ≤ -0.42503 | 15 | 1.7149 | 0.053 |
| Difference ≥ 0.42503 | 15 | -12.303 | 0.000 |

