Samples must be random
A random sample is a subset of a population selected by a process that makes all samples of a specified size equally likely to occur. In statistics, you use a random sample to make generalizations, or inferences, about a population.
But a sample must be randomly collected to accurately represent the entire population from which it comes. You should carefully plan your data collection process to ensure that your sample is random. In addition, the process or population that the data come from should be stable.
Samples must be random to eliminate selection bias. Selection bias means that some subjects are more likely to be in the sample than other subjects are. If the sample is biased, you can only make inferences about the subjects in the sample, not about the entire population.
Suppose you want to start a new ad campaign, but are unsure whether print, radio, or television is the best way to get to your customers. While it is not practical or cost-effective to survey all your customers, it is possible to survey a random sample. At first, you are inclined to survey only those customers who have returned a mail-in rebate because these customers are more likely to respond to a survey. However, this sample does not represent the entire population because each customer does not have an equal chance of being selected. This could lead to bad business decisions. Instead, you decide to randomly select customers from an alphabetical list of all customers. From this data, you can make inferences about your customer base to determine the best way to allocate your advertising dollars.
Determine whether a sample is random by using a runs test
After you collect the data, one way to check whether your data are random is to use a runs test to look for a pattern in your data over time. To perform a runs test in Minitab, choose .
There are also other graphs that can identify whether a sample is random.
Example of using a time series plot to determine that data are not random
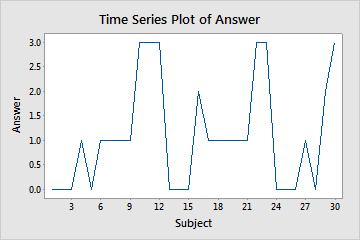
Suppose an interviewer selects 30 people at random and asks them each a question for which there are four possible answers. Their responses are coded 0, 1, 2, 3. The interviewer creates a time series plot to check the randomness of the answers.

Time series plot of answers
The pattern in the data indicates that the data are not random. The interviewer investigates to determine whether a bias exists in the phrasing of the questions or in the selection of the subjects.
