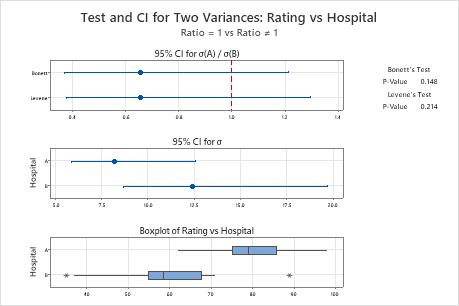
A healthcare consultant wants to compare the patient satisfaction ratings of two hospitals. The consultant collects ratings from 20 patients for each of the hospitals.
The consultant performs a 2 variances test to determine whether the standard deviations in the patient ratings from the two hospitals differ.
- Open the sample data, HospitalComparison.MWX.
- Choose .
- From the drop-down list, select Both samples are in one column.
- In Samples, enter Rating.
- In Sample IDs, enter Hospital.
- Click OK.
Interpret the results
The null hypothesis states that the ratio between the standard deviations is 1. Because the p-values are both greater than the significance level (denoted as α or alpha) of 0.05, the consultant fails to reject the null hypothesis. The consultant does not have enough evidence to conclude that the standard deviations between the hospitals are different.
Method
| σ₁: standard deviation of Rating when Hospital = A |
|---|
| σ₂: standard deviation of Rating when Hospital = B |
| Ratio: σ₁/σ₂ |
| The Bonett and Levene's methods are valid for any continuous distribution. |
Descriptive Statistics
| Hospital | N | StDev | Variance | 95% CI for σ |
|---|---|---|---|---|
| A | 20 | 8.183 | 66.958 | (5.893, 12.597) |
| B | 20 | 12.431 | 154.537 | (8.693, 19.709) |
Ratio of Standard Deviations
| Estimated Ratio | 95% CI for Ratio using Bonett | 95% CI for Ratio using Levene |
|---|---|---|
| 0.658241 | (0.372, 1.215) | (0.378, 1.296) |
Test
| Null hypothesis | H₀: σ₁ / σ₂ = 1 |
|---|---|
| Alternative hypothesis | H₁: σ₁ / σ₂ ≠ 1 |
| Significance level | α = 0.05 |
| Method | Test Statistic | DF1 | DF2 | P-Value |
|---|---|---|---|---|
| Bonett | 2.09 | 1 | 0.148 | |
| Levene | 1.60 | 1 | 38 | 0.214 |

