Cube plots can be used to show the relationships between two to eight factors with or without a response measure for 2-level factorial designs or Plackett-Burman designs. Viewing the factors without the response lets you to see what a design looks like. If there are only two factors, Minitab displays a square plot. You can draw a cube plot for either data means or fitted means.
- Data means
- The means of the raw response variable data for each factor level combination
- Fitted means
- After analyzing the design, the fitted means are the predicted values for each factor level combination. To plot the fitted means, you must fit the full model.
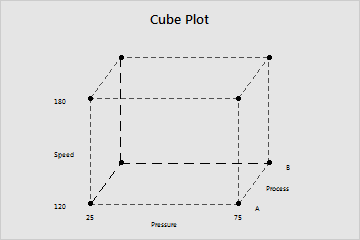
Cube plot without a response
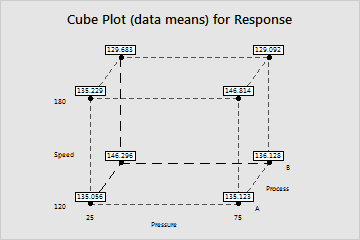
Cube plot with a response
Note
Although you can use these plots to compare effects, be sure to evaluate significance by examining the effects in the analysis of variable table.