A financial analyst investigates the factors that are associated with the probability that a college student has certain credit cards. The analyst randomly samples college students for a survey. The survey asks the students questions about their education and finances.
Because the response is binary, the analyst uses binary logistic regression to determine whether the financial variables are related to the probability that the college students have an American Express credit card. The analyst creates a plot based on the binary logistic regression model to better understand the relationship between the predictors and the probability that the college students have an American Express credit card.
- Open the sample data, CreditSurvey.MWX.
- Choose .
- From Response, select American Express.
- Under Select a pair of variables for a single plot, select Cash from X Axis and select Annual Income from Y Axis.
- Click OK.
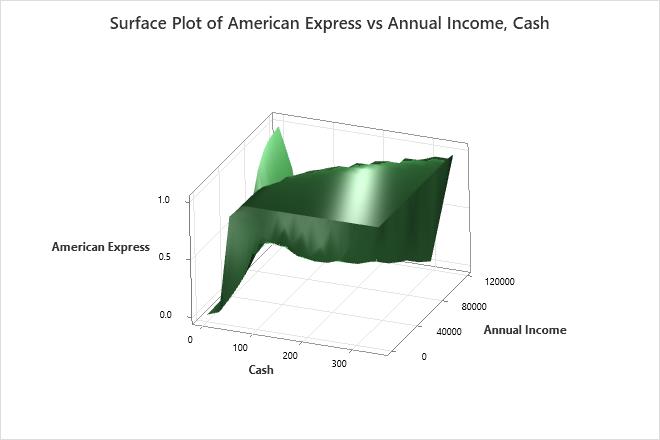
Interpret the results
Minitab uses the stored model to create the surface plot. The response surface has a complex shape that is difficult to describe. In general, students with more cash in their wallet and lower incomes have a higher probability of having an American Express credit card. Students with a small amount of cash have a low probability of having an American Express credit card, unless they also have a very high annual income. Students with a higher annual income have a lower probability of having an American Express credit card, unless they also have either a very low or a very high amount of cash.