When you use , the results are a model diagram. Use the results for the model diagram to verify the models to use for optimization. If the results meet expectations, select Response Optimizer from the results to proceed with the optimization.
Model Performance
| Response Variable | Model | Validation Method |
|---|---|---|
| Fill State | Random Forests® Multinomial Classification 1 | Out-of-Bag |
| Extra Weight | MARS® Regression 1 | 5 Fold Cross Validation |
| Strength | TreeNet® Regression 1 | 5 Fold Cross Validation |
| Response Variable | Performance |
|---|---|
| Fill State | Misclassification rate: 7.24% |
| Extra Weight | R-squared: 87.97% |
| Strength | R-squared: 89.92% |
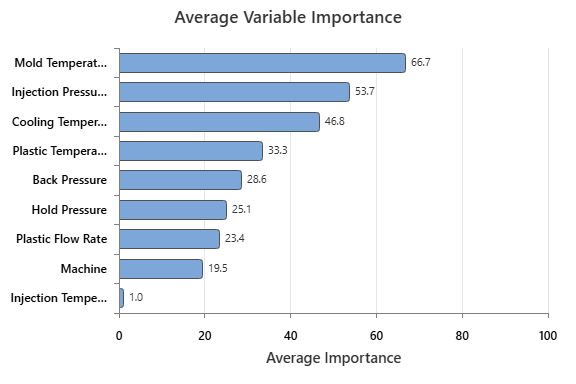
Variable Ranges
| Variable | Average Importance | ID | Values | Responses |
|---|---|---|---|---|
| Mold Temperature | 66.6667 | 9 | [30.1, 1649.5] | Extra Weight, Strength |
| Injection Pressure | 53.7347 | 1 | [75, 150] | All |
| Cooling Temperature | 46.8183 | 2 | [25, 45] | All |
| Plastic Temperature | 33.3333 | 5 | [200, 400] | Fill State |
| Back Pressure | 28.5955 | 4 | [0.4, 0.7] | Fill State |
| Hold Pressure | 25.1115 | 3 | [21, 48] | Fill State, Extra Weight |
| Plastic Flow Rate | 23.3546 | 6 | [10, 50] | Fill State |
| Machine | 19.5256 | 7 | 1, 2, 3, 4 | Extra Weight, Strength |
| Injection Temperature | 0.9739 | 8 | [85, 100] | Extra Weight |
Key Results: Model and variable information
For these data, the analysis includes 3 response variables, Fill State, Extra Weight and Strength. The Model Performance table displays performance statistics such as R-squared or the misclassification rate. Use the performance statistics to help you to assess whether the model performance is adequate.
The Variable Ranges table displays the importances and ranges of the predictors. If a problem is present, such as an expected variable is missing, refit the model.