A team of researchers wants to use data from an injection molding process to study settings for machines that maximize one type of strength of a plastic part. The variables include controls on the machines, different plastic formulas, and the injection molding machines. The team wants to identify process settings that produce parts with high strength while minimizing excess weight. These two responses are of special interest because one way to achieve high strength is to make denser, heavier parts. The analysis also includes a multinomial response variable that classifies parts as underfilled, nominal, or overfilled.
The engineers fit predictive models for both responses and use Response Optimizer to find predictor settings that balance the tradeoff between the two responses.
- Open the sample data, InjectionProcessMultipleResponses.MPX.
- Choose .
- Select Fill State in Worksheet 1. Then, select Random Forests® Multinomial Classification 1 as the model.
- Select Extra Weight in Worksheet 1. Then, select MARS® Regression 1 as the model.
- Select Strength in Worksheet 1. Then, select TreeNet® Regression 1 as the model.
- Select OK.
Verify the models
The results for the model diagram show that the performance of the models, the variable ranges, and the variable importances. The team agrees that the R-squared values that are high enough and that the misclassification rate is low enough. The team also agrees that the variables have their expected ranges. Because the results are what the team expected, the team proceeds to the optimization analysis.
Model Performance
| Response Variable | Model | Validation Method |
|---|---|---|
| Fill State | Random Forests® Multinomial Classification 1 | Out-of-Bag |
| Extra Weight | MARS® Regression 1 | 5 Fold Cross Validation |
| Strength | TreeNet® Regression 1 | 5 Fold Cross Validation |
| Response Variable | Performance |
|---|---|
| Fill State | Misclassification rate: 7.24% |
| Extra Weight | R-squared: 87.97% |
| Strength | R-squared: 89.92% |
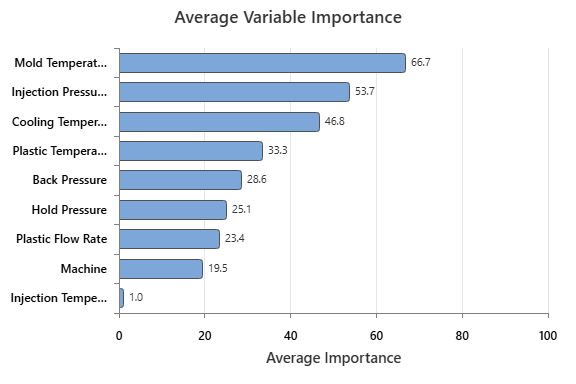
Variable Ranges
| Variable | Average Importance | ID | Values | Responses |
|---|---|---|---|---|
| Mold Temperature | 66.6667 | 9 | [30.1, 1649.5] | Extra Weight, Strength |
| Injection Pressure | 53.7347 | 1 | [75, 150] | All |
| Cooling Temperature | 46.8183 | 2 | [25, 45] | All |
| Plastic Temperature | 33.3333 | 5 | [200, 400] | Fill State |
| Back Pressure | 28.5955 | 4 | [0.4, 0.7] | Fill State |
| Hold Pressure | 25.1115 | 3 | [21, 48] | Fill State, Extra Weight |
| Plastic Flow Rate | 23.3546 | 6 | [10, 50] | Fill State |
| Machine | 19.5256 | 7 | 1, 2, 3, 4 | Extra Weight, Strength |
| Injection Temperature | 0.9739 | 8 | [85, 100] | Extra Weight |
Peform the optimization
- In the results, select Response Optimizer.
- In the Fill State row, select Nominal in Optimizer classes. Select Maximize in Goal.
- In the Extra Weight row, select Minimize in Goal.
- In the Strength row, select Maximize in Goal.
- Select Desirability.
- In the Extra Weight row, specify the following values:
Target Upper Weight Importance 0 2 1 1 - In the Strength row, specify the following values:
Lower Target Weight Importance 300 1600 1 3 - Select OK in each dialog box.
Minitab uses the stored models to estimate the predictor settings that optimize the values of the response variables. The combined or composite desirability of these responses is approximately 0.8, which indicates that the solution did not meet the target for at least 1 response.
The Variable Ranges table includes the average importance of the variables across the models in the optimization. In these data, Mold Temperature is the most important variable. The variables are in the table in order of average importance, so Mold Temperature is at the top.