Technicians measure heat flux and insolation as part of a solar thermal energy test. An energy engineer wants to determine how heat flux and insolation are predicted by the position of the east, south, and north focal points.
The engineer wants to arrange the focal points to receive a target amount of solar radiation while creating a target amount of heat. The engineer fits regression models for both responses and uses Response Optimizer to find predictor settings that produce acceptable values for both responses: Heat Flux and Insolation.
- Open the sample data, ThermalEnergyTest.MWX.
- Choose .
- In the Insolation row, select Target in Goal, and enter 750 in Target.
- In the Heat Flux row, select Target in Goal, and enter 200 in Target.
- Click OK.
Interpret the results
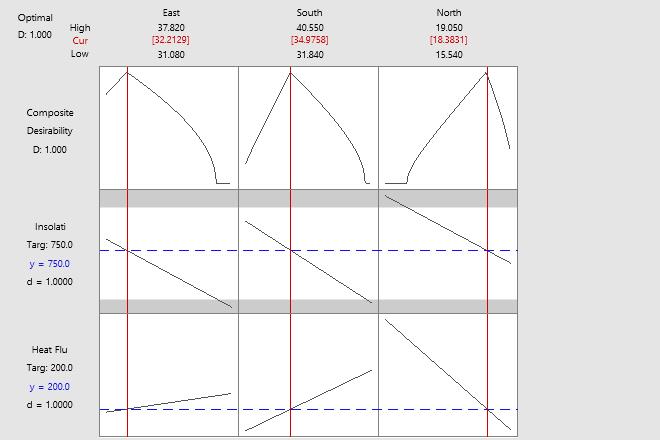
Minitab uses the two stored models to estimate the predictor settings that optimize the values of both response variables. The combined or composite desirability of these two responses is 1, which indicates an excellent solution.
The engineer decides to set the focal points at the values shown in the graph. That is, set East at 32.2129, South at 34.9758, and North at 18.3831. The output indicates that the predicted responses for these settings are 750.0 for Insolation and 200.00 for HeatFlux. The prediction intervals indicate the precision of these predictions.
You can adjust the factor settings of this initial solution directly on the plot. Move the vertical bars to change the factor settings and see how the individual desirability (d) of the responses and the composite desirability change.

Parameters
| Response | Goal | Lower | Target | Upper | Weight | Importance |
|---|---|---|---|---|---|---|
| Insolation | Target | 568.55 | 750 | 909.45 | 1 | 1 |
| Heat Flux | Target | 181.50 | 200 | 278.70 | 1 | 1 |
Solution
| Solution | East | South | North | Insolation Fit | Heat Flux Fit | Composite Desirability |
|---|---|---|---|---|---|---|
| 1 | 32.2129 | 34.9758 | 18.3831 | 750 | 200 | 1 |
Multiple Response Prediction
| Variable | Setting |
|---|---|
| East | 32.2129 |
| South | 34.9758 |
| North | 18.3831 |
| Response | Fit | SE Fit | 95% CI | 95% PI |
|---|---|---|---|---|
| Insolation | 750.0 | 34.3 | (679.3, 820.7) | (621.8, 878.2) |
| Heat Flux | 200.00 | 5.14 | (189.41, 210.59) | (179.37, 220.63) |
