In This Topic
Grouping information table for multiple pairwise comparisons
Minitab uses the confidence interval results for the difference between two level means to obtain the grouping information. The grouping information is in a matrix. Suppose a term has k levels, then the maximum dimension of the matrix is k x k. If all levels are in one group, then the dimension is k x 1, with letter "A" for all factor levels. If all levels are in different groups, the dimension is k x k with letters on the diagonal only.
- Sort all the least square means at different levels of a term in descending order, denoted as 1, 2, ... , k.
- Define a k x k matrix with value 0 in every cell where k = the number of factor levels.
- For column j, where j = 1, ... , Minitab does the following:
- Checks the confidence intervals of mean j – mean r, where r = j + 1, .. , k. If the interval for r contains 0, set the rth row and the jth column cell, j) as 1.
- Sets (j, j) cell as 1 if at least one cell in column j has value 1.
- Calculates the row sums from column 1 to column j for row I = j + 1, ... , k. If min (all row sums) >= 1, terminate the loop; otherwise, increase j by 1 and go to step a.
- For every row i, Minitab checks the sum of all column values for the row ≥ 1. If the sum is zero, set the cell of row i and column j = 1, where column j is the first column in the matrix with 0 values. This procedure produces a matrix with values 1 and 0. The total number of groups is the number of nonzero columns.
- Minitab matches letters to columns (e.g. A to Column 1, B to Column 2, etc.) and assigns cells with value 1 the correct letter.
Grouping information table for multiple comparisons with a control
Minitab uses the confidence interval results for the difference between each level mean and the control level to obtain the grouping information. The grouping information is in a matrix with one column.
Minitab assigns the letter "A" to the control level.
If an interval contains 0, then the level mean is in the same group as the control level. Minitab assigns the letter "A" to the level mean.
If an interval does not contain zero, then no letter is assigned.
Tukey method
Formula
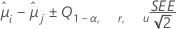
Tukey's method is available for all pairwise comparisons. The formula for the confidence intervals is:
The formula for the test statistic is:


For details on the calculation of the adjusted p-value, see the references below.
To find the individual error rate from the simultaneous error rate, use the following formula:

Notation
| Term | Description |
|---|---|
 | the least squares mean for the ith factor level or factor level combination |
 | the least squares mean for the jth factor level or factor level combination |
| r | the number of means |
| Q1 − α, r, u | the 1 − α percentile of the Studentized range distribution for r means to compare with u degrees of freedom |
| u | the degrees of freedom for error from the model |
| SEE | the standard error of the estimated difference between the least squares means |
| α | the simultaneous probability of making a Type I error, based on the Studentized range distribution |
| α* | the individual probability of making a Type I error, based on the t-distribution for one comparison |
References
1 Braun, H. I., editor (1994). The collected works of John W. Tukey: Volume VIII Multiple comparisons 1948-1983. New York: Chapman and Hall.
2 J.C. Hsu (1996). Multiple Comparisons: Theory and methods. Chapman & Hall.
Fisher method
Formula
Minitab offers different confidence interval methods for comparing treatment means. For the Fisher method, the confidence interval endpoints and p-values are the same whether the comparisons are pairwise or with a control. The Fisher method uses the individual confidence level. The formula for the confidence intervals is:

The formula for the test statistic is:

The p-value = 2*P{ T u > tu}
To find the simultaneous confidence level from the individual error rate, use the following formula:

Notation
| Term | Description |
|---|---|
 | the least squares mean for the ith factor level or factor level combination |
 | the least squares mean for the jth factor level or factor level combination |
| t1-α*/2, u | the upper α*/2 percentile of the Student's t-distribution with u degrees of freedom |
| Tu | Random variable with a T distribution that has u degrees of freedom for error |
| Q | random variable with a Studentized range distribution |
| α | the simultaneous probability of making a Type I error |
| α* | the individual probability of making a Type I error |
| u | the degrees of freedom for error from the model |
| SEE | the standard error of the estimated difference between the least squares means |
Bonferroni method
Formula
Minitab offers different confidence interval methods for comparing treatment means. Because the Bonferroni method makes no assumptions about the dependence among the comparisons, it is the most conservative method. "Conservative" in this context indicates that the true confidence level is likely to be greater than the confidence level that is displayed. The formula for the confidence intervals is:

The formula for the test statistic is:

Notation
| Term | Description |
|---|---|
 | the least squares mean for the ith factor level or factor level combination |
 | the least squares mean for the jth factor level or factor level combination |
| t1-α*/2, u | the upper α' /2 percentile of the Student's t-distribution with u degrees of freedom |
| α | the simultaneous probability of making a Type I error |
| α' | α / c |
| c | the number of comparisons |
| u | the degrees of freedom for error from the model |
| SEE | the standard error of the estimated difference between the least squares means |
The number of comparisons depends on whether the comparisons are pairwise or with a control. Let k be the number of means that are being compared. The number of comparisons are in the table below.
| Pairwise | k (k – 1) / 2 |
| With a control | k – 1 |
Sidak method
Formula
Minitab offers different confidence interval methods for comparing treatment means. The Sidak method treats the comparisons as if they were independent, which produces a conservative approximation of the true error rate. The Sidak method is slightly more powerful than the Bonferroni method.
The formula for the confidence intervals is:

The formula for the test statistic is:

The adjusted p-value = 1 − (1 − p)c.
Notation
| Term | Description |
|---|---|
 | the least squares mean for the ith factor level or factor level combination |
 | the least squares mean for the jth factor level or factor level combination |
| t1-α*/2, u | the upper α' /2 percentile of the Student's t-distribution with u degrees of freedom |
| α | the simultaneous probability of making a Type I error |
| α' | 1 – (1 – α ) 1/ k |
| u | the degrees of freedom for error from the model |
| SEE | the standard error of the estimated difference between the least squares means |
| p | The unadjusted p-value from the t-distribution for a comparison |
| c | the number of comparisons |
The number of comparisons depends on whether the comparisons are pairwise or with a control. Let k be the number of factor combinations. The number of comparisons are in the table below.
| Pairwise | k (k – 1) / 2 |
| With a control | k – 1 |
Dunnett method
Formula
Minitab offers different confidence interval methods for comparing treatment means. Dunnet's method is available for comparisons with a control. The formula for the confidence intervals is:

The formula for the test statistic is:

The adjusted p-value is the result of integrating the distribution that Dunnett proposes for the test statistic. For details, see the references below.
Notation
| Term | Description |
|---|---|
 | the least squares mean for the ith factor level or factor level combination |
 | the least squares mean for the jth factor level or factor level combination |
| D1-α, k-1, u | the upper α percentile of the distribution that Dunnett proposes with k − 1 comparisons and u degrees of freedom |
| α | the simultaneous probability of making a Type I error |
| k | the number of means to compare |
| u | the degrees of freedom for error from the model |
| SEE | the standard error of the estimated difference between the least squares means |
References
1 Dunnett, C. W. (January 01, 1955). A multiple comparison procedure for comparing several treatments with a control. Journal of the American Statistical Association, 50, 1096-1121.
2 J.C. Hsu (1996). Multiple Comparisons: Theory and methods. Chapman & Hall.