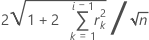
The graphs for the ACF and PACF of the ARIMA residuals include lines representing two standard errors to either side of zero. Values that extend beyond two standard errors are statistically significant at approximately a = 0.05, and show evidence that the model has not explained all autocorrelation in the data. For ACF the distance between the lines and zero for the i th autocorrelation are determined by the following formula:
Where n = the number of observations in the series, and rk = the ki autocorrelation.
The distance between the lines and zero for all partial autocorrelations is .
 .
.