In This Topic
Step 1: Determine whether the model fits your data
- If the model fits the data, you can perform Decomposition and compare the two models.
- If the model does not fit the data, examine the plot for a lack of seasonality. If there is no seasonal pattern, you should use a different time series analysis. For more information, go to Which time series analysis should I use?.
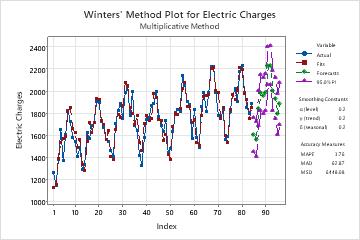
On this plot, the fits closely follow the data, which indicates that the model fits the data.
Step 2: Compare the fit of your model to other models
Note
The accuracy measures provide an indication of the accuracy you might expect when you forecast out 1 period from the end of the data. Therefore, they do not indicate the accuracy of forecasting out more than 1 period. If you're using the model for forecasting, you shouldn't base your decision solely on accuracy measures. You should also examine the fit of the model to ensure that the forecasts and the model follow the data closely, especially at the end of the series.
Model 1
Accuracy Measures
| MAPE | 7.265 |
|---|---|
| MAD | 16.621 |
| MSD | 518.119 |
Model 2
Accuracy Measures
| MAPE | 2.474 |
|---|---|
| MAD | 9.462 |
| MSD | 135.701 |
Key Results: MAPE, MAD, MSD
In these results, all three numbers are lower for the 2nd model compared to the 1st model. Therefore, the 2nd model provides the better fit.
Step 3: Determine whether the forecasts are accurate
Examine the fits and the forecasts in the plot to determine whether the forecasts are likely to be accurate. The fits should follow the data closely, especially at the end of the series. When using a seasonal model it is especially important to verify that the fits match the actual values at the end of the time series. If the seasonal pattern or trend do not match up with the fits at the end of the data, the forecasts are likely to be less accurate. In this case, collect more data so the model can adapt to changes in the seasonal pattern or trend.
If the model fits the data at the end of the series, you can usually safely predict at least one full seasonal cycle.
On this plot, the fits closely follow the data and the seasonal pattern and trend are stable at the end of the data. The forecasts are likely to be accurate for the next year.