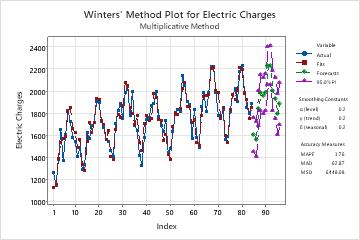
Budget planners for a local business office want to predict electricity costs for the next year. They collect data on utility usage during the previous 84 billing periods to predict future usage.
- Open the sample data, UtilityUsage.MWX.
- Choose .
- In Variable, enter Electric Charges.
- In Seasonal length, enter 12.
- Select Generate forecasts. In Number of forecasts, enter 12.
- Click OK.
Interpret the results
On the Winters' method plot, the fits closely follow the data and the seasonal pattern and trend are stable at the end of the data. The budget planners can conclude that the forecasts for the electricity costs are likely to be accurate for the next year.
Method
| Model type | Multiplicative Method |
|---|---|
| Data | Electric Charges |
| Length | 84 |
Smoothing Constants
| α (level) | 0.2 |
|---|---|
| γ (trend) | 0.2 |
| δ (seasonal) | 0.2 |
Accuracy Measures
| MAPE | 3.76 |
|---|---|
| MAD | 62.87 |
| MSD | 6448.08 |
Forecasts
| Period | Forecast | Lower | Upper |
|---|---|---|---|
| 85 | 1607.56 | 1453.52 | 1761.60 |
| 86 | 1568.33 | 1411.87 | 1724.78 |
| 87 | 1845.46 | 1686.32 | 2004.61 |
| 88 | 1990.05 | 1827.96 | 2152.15 |
| 89 | 1964.94 | 1799.63 | 2130.24 |
| 90 | 1992.04 | 1823.29 | 2160.78 |
| 91 | 2231.43 | 2059.03 | 2403.83 |
| 92 | 2235.76 | 2059.49 | 2412.03 |
| 93 | 2007.06 | 1826.72 | 2187.39 |
| 94 | 1937.18 | 1752.60 | 2121.76 |
| 95 | 1795.32 | 1606.32 | 1984.31 |
| 96 | 1890.92 | 1697.36 | 2084.48 |

