In This Topic
Step 1: Determine whether the model fits your data
- If the model fits the data, you can perform Double Exponential Smoothing and compare the two models.
- If the model does not does fit the data, perform the analysis again and select a different type of model. If you fit a linear model and see curvature in the data, select the quadratic, exponential, or S-curve model. If none of the models fit your data, use a different time series analysis. For more information, go to Which time series analysis should I use?.
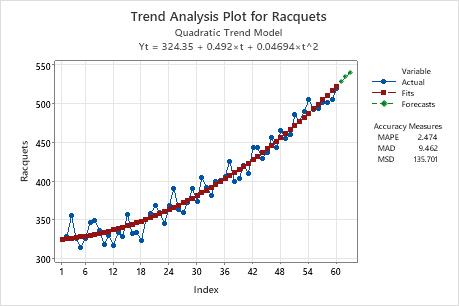
On this trend analysis plot, the fits closely follow the data, which indicates that the model fits the data.
Step 2: Compare the fit of your model to other models
Note
The accuracy measures provide an indication of the accuracy you might expect when you forecast out 1 period from the end of the data. Therefore, they do not indicate the accuracy of forecasting out more than 1 period. If you're using the model for forecasting, you shouldn't base your decision solely on accuracy measures. You should also examine the fit of the model to ensure that the forecasts and the model follow the data closely, especially at the end of the series.
Model 1
Accuracy Measures
| MAPE | 7.265 |
|---|---|
| MAD | 16.621 |
| MSD | 518.119 |
Model 2
Accuracy Measures
| MAPE | 2.474 |
|---|---|
| MAD | 9.462 |
| MSD | 135.701 |
Key Results: MAPE, MAD, MSD
In these results, all three numbers are lower for the 2nd model compared to the 1st model. Therefore, the 2nd model provides the better fit.
Step 3: Determine whether the forecasts are accurate
Examine the end of the trend analysis plot and the forecasts to determine whether the forecasts are likely to be accurate. The fits should follow the data closely, especially at the end of the series. If the fits start to shift away from the data at the end of the series, the underlying trend may be changing. If the trend is changing, the model might not generate accurate forecasts. In this case, collect more data to determine whether the trend over a longer period of time is less consistent.
Even if your forecasts appear to be accurate, be cautious about forecasts that are more than 3 periods in the future. Trends observed over a short span of data could be part of a larger cycle and may not persist into the future. Because trends can be volatile, you should usually only forecast 2 or 3 periods into the future.
On this trend analysis plot, the fits closely follow the data, especially at the end of the series. You can conclude that the forecasts for the next 3 months are accurate.