A toothpaste retailer collects sales data and the number of commercials that were broadcast during the previous 60 weeks. The retailer creates a time-series model for prediction of sales.
- Open the sample data, ToothpasteSales.MWX.
- Choose .
- In Variable, enter Sales.
- Select Generate forecasts. In Number of forecasts, enter 6.
- Click OK.
Interpret the results
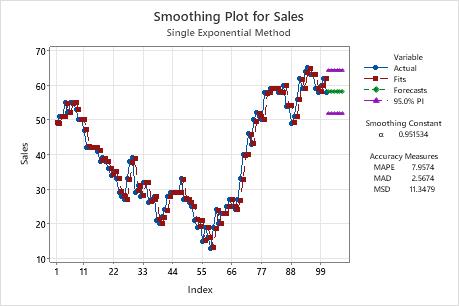
On the smoothing plot, the forecasts and line closely follow the data, especially at the end of the series. The retailer can be 95% confident that the sales will be between approximately 52 and 65 for the next 6 months.
Method
| Data | Sales |
|---|---|
| Length | 101 |
Smoothing Constant
| α | 0.951534 |
|---|
Accuracy Measures
| MAPE | 7.9574 |
|---|---|
| MAD | 2.5674 |
| MSD | 11.3479 |
Forecasts
| Period | Forecast | Lower | Upper |
|---|---|---|---|
| 102 | 58.1889 | 51.8989 | 64.4790 |
| 103 | 58.1889 | 51.8989 | 64.4790 |
| 104 | 58.1889 | 51.8989 | 64.4790 |
| 105 | 58.1889 | 51.8989 | 64.4790 |
| 106 | 58.1889 | 51.8989 | 64.4790 |
| 107 | 58.1889 | 51.8989 | 64.4790 |