In This Topic
Step 1: Determine whether the model fits your data
- If the model fits the data, you can perform Trend Analysis and compare the two models.
- If the model does not fit the data, examine the plot for seasonality or a lack of a trend. If you see evidence of seasonality or lack of a trend, you should use a different time series analysis. For more information, go to Which time series analysis should I use?.
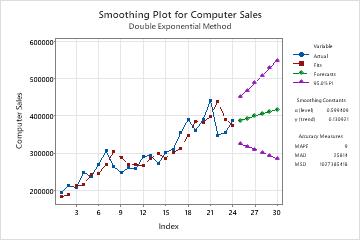
On this smoothing plot, the fits closely follow the data, which indicates that the model fits the data.
Step 2: Compare the fit of your model to other models
Note
The accuracy measures provide an indication of the accuracy you might expect when you forecast out 1 period from the end of the data. Therefore, they do not indicate the accuracy of forecasting out more than 1 period. If you're using the model for forecasting, you shouldn't base your decision solely on accuracy measures. You should also examine the fit of the model to ensure that the forecasts and the model follow the data closely, especially at the end of the series.
Model 1
Accuracy Measures
| MAPE | 7.265 |
|---|---|
| MAD | 16.621 |
| MSD | 518.119 |
Model 2
Accuracy Measures
| MAPE | 2.474 |
|---|---|
| MAD | 9.462 |
| MSD | 135.701 |
Key Results: MAPE, MAD, MSD
In these results, all three numbers are lower for the 2nd model compared to the 1st model. Therefore, the 2nd model provides the better fit.
Step 3: Determine whether the forecasts are accurate
Examine the fits and the forecasts in the plot to determine whether the forecasts are likely to be accurate. The fits should follow the data closely, especially at the end of the series. If the fits shift away from the data at the end of the series, or if the trend line in the forecasts does match the general flow of the data, the underlying trend may still be adjusting to the change. Try collecting more data to determine whether any changes in the underlying trend are short-term or appear to be long-term.
Even if your forecasts appear to be accurate, you should be cautious in projecting forecasts too far into the future. You should usually only forecast 6 periods into the future.
On this smoothing plot, the trend seems to change at the end of the series. The trend line in the forecasts is not quite as steep as the overall long-term trend in the data, but that difference is due to the model correcting for the change in trend at the end of the series. The forecasts predict a slight upward trend in sales for the next 6 months.