Enter your data
Complete the following steps to specify the column of data that you want to analyze.
- In Variable, enter a column of numeric data that were collected at regular intervals and recorded in time order. If your data are in multiple columns (for example, you have data for each year in a separate column), you must stack the data into a single column.
You must have at least 2 full seasons of data for Minitab to perform the analysis. However, it is recommended that you have 4 to 5 full seasonal cycles. If you do not have enough full cycles, you many not have enough data to calculate reasonable estimates of the seasonal indices.
- In Seasonal
length, enter the number of observations that occur in one season. For example, if you collect data monthly and they have a yearly pattern, enter 12.
If you do not know the seasonal length, use or to help you identify the length.
In this worksheet, Sales contains the number of computers that are sold each month.
| C1 |
|---|
| Sales |
| 195000 |
| 213330 |
| 208005 |
| 249000 |
| 237040 |
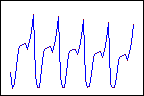
Model Type

Multiplicative
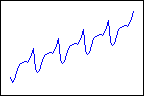
Additive
- Use to identify the correct model.
- Try both Multiplicative and Additive, and then compare the accuracy measures to determine which model provides a better fit.
Note
You should not fit a multiplicative model when your data contain negative values. When you have positive and negative data, the multiplicative seasonal indices for the negative data are the inverse of what they are for the positive data. This causes the model to not fit the data.
Model Components
Choose the components to include in the model. If you are unsure, use to determine whether your data has a trend.
Trend plus seasonal
Seasonal only
Generate forecasts
Complete the following steps to generate forecasts for your time series.
- Select Generate forecasts.
- In Number of forecasts, enter the number of consecutive time periods that you want forecasts for.
- In Starting from
origin, specify the row number for the first forecast. If you leave this field blank, Minitab starts the forecasts at the end of the time series.
If you enter a value, Minitab uses only the data up to that row number for the forecasts. The forecast values differ from the fits because Minitab uses all of the data to calculate the fits.
For example, an analyst has monthly data for January through December. In December, the analyst wants to generate a forecast for the next month, but December's data are incomplete. In Number of forecasts, the analyst enters 2. In Starting from origin, the analyst enters 12. Minitab uses the data through November to generate forecasts for December and January.