In This Topic
Multiplicative
Formula
Yt = Trend × Seasonal × Error
Notation
| Term | Description |
|---|---|
| Yt | observation at time t |
Additive
Formula
Yt = Trend + Seasonal + Error
Notation
| Term | Description |
|---|---|
| Yt | observation at time t |
Model fitting
- Minitab smoothes the data using a centered moving average with a length equal to the length of the seasonal cycle. When the seasonal cycle length is an even number, a two-step moving average is required to synchronize the moving average correctly.
- Minitab either divides the moving average into (multiplicative model) or subtracts it from (additive model) the data to obtain what are often referred to as raw seasonal values.
- For corresponding time periods in the seasonal cycles, Minitab determines the median of the raw seasonal values. For example, if you have 60 consecutive months of data (5 years), Minitab determines the median of the 4 raw seasonal values corresponding to January, to February, and so on.
- Minitab adjusts the medians of the raw seasonal values so that their average is one (multiplicative model) or zero (additive model). These adjusted medians constitute the seasonal indices.
- Minitab uses the seasonal indices to seasonally adjust the data.
- Minitab fits a trend line to the seasonally adjusted data using least squares regression.
The data can be detrended by either dividing the data by the trend component (multiplicative model) or subtracting the trend component from the data (additive model).
Forecasting
Decomposition calculates the forecast as the linear regression line multiplied by (multiplicative model) or added to (additive model) the seasonal indices. Data prior to the forecast origin are used for the decomposition.
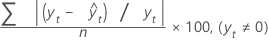
MAPE
Mean absolute percentage error (MAPE) measures the accuracy of fitted time series values. MAPE expresses accuracy as a percentage.
Formula
Notation
| Term | Description |
|---|---|
| yt | actual value at time t |
 | fitted value |
| n | number of observations |
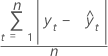
MAD
Mean absolute deviation (MAD) measures the accuracy of fitted time series values. MAD expresses accuracy in the same units as the data, which helps conceptualize the amount of error.
Formula
Notation
| Term | Description |
|---|---|
| yt | actual value at time t |
 | fitted value |
| n | number of observations |
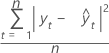
MSD
Mean squared deviation (MSD) is always computed using the same denominator, n, regardless of the model. MSD is a more sensitive measure of an unusually large forecast error than MAD.
Formula
Notation
| Term | Description |
|---|---|
| yt | actual value at time t |
 | fitted value |
| n | number of observations |