A marketing analyst wants to predict sales of a golf driver. The analyst collects previous sales data to predict the sales of the product for the next 3 months.
- Open the sample data, GolfDriverSales.MWX.
- Choose .
- In Variable, enter Sales.
- In Seasonal length, enter 12.
- Under Model Type, choose Additive.
- Select Generate forecasts. In Number of forecasts, enter 3.
- Click OK.
Interpret the results
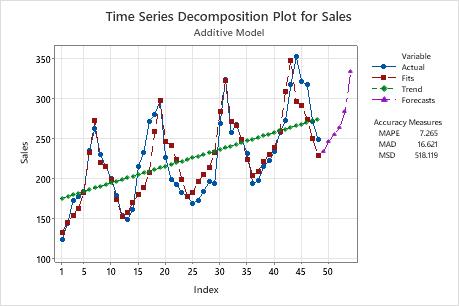
The time series decomposition plot shows that the model underpredicts the data at the end of the series. This indicates that Decompostion does not adequately model the trend or the seasonal pattern. The analyst should try Winters' method to determine whether it provides a better fit to the data.
Method
| Model type | Additive Model |
|---|---|
| Data | Sales |
| Length | 48 |
| NMissing | 0 |
Fitted Trend Equation
| Yt = 173.06 + 2.111×t |
|---|
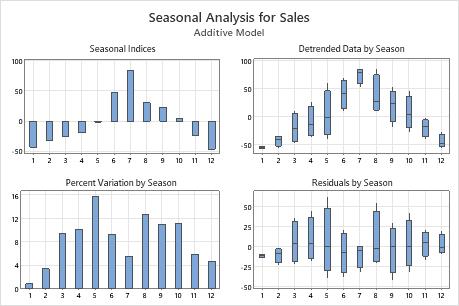
Seasonal Indices
| Period | Index |
|---|---|
| 1 | -42.8472 |
| 2 | -32.2639 |
| 3 | -25.4306 |
| 4 | -18.5972 |
| 5 | -1.3056 |
| 6 | 47.3194 |
| 7 | 84.1111 |
| 8 | 30.5278 |
| 9 | 23.2361 |
| 10 | 4.1111 |
| 11 | -22.8472 |
| 12 | -46.0139 |
Accuracy Measures
| MAPE | 7.265 |
|---|---|
| MAD | 16.621 |
| MSD | 518.119 |
Forecasts
| Period | Forecast |
|---|---|
| 49 | 233.672 |
| 50 | 246.367 |
| 51 | 255.312 |
| 52 | 264.256 |
| 53 | 283.659 |
| 54 | 334.396 |