The autocorrelation function is a measure of the correlation between observations of a time series that are separated by k time units (yt and yt–k).
Interpretation
Use the autocorrelation function and the partial autocorrelation functions together to identify ARIMA models. Examine the spikes at each lag to determine whether they are significant. A significant spike will extend beyond the significance limits, which indicates that the correlation for that lag doesn't equal zero.
Note
The data should be stationary before you interpret the autocorrelation plot. A stationary time series has a mean, variance, and autocorrelation function that are essentially constant through time. For more information, go to Data considerations for autocorrelation function.
| Pattern | What the pattern indicates | Example |
|---|---|---|
| Large spike at lag 1 that decreases after a few lags. | An autoregressive term in the data. Use the partial autocorrelation function to determine the order of the autoregressive term. | 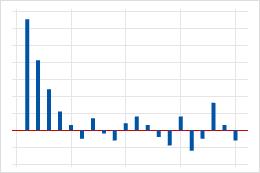 |
| Large spike at lag 1 followed by a decreasing wave that alternates between positive and negative correlations. | A higher order autoregressive term in the data. Use the partial autocorrelation function to determine the order of the autoregressive term. | 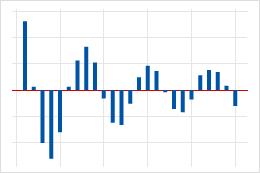 |
| Significant correlations at the first or second lag, followed by correlations that are not significant. | A moving average term in the data. The number of significant correlations indicates the order of the moving average term. | 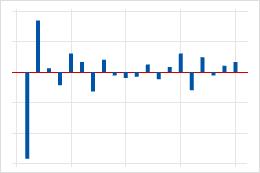 |
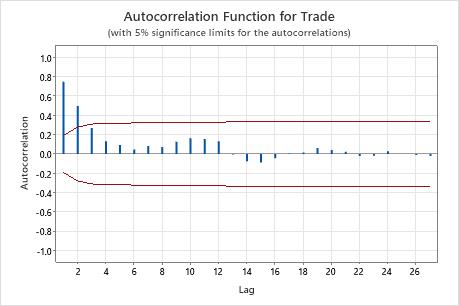
On this plot, there is a significant correlation at lag 1 that decreases after a few lags. This pattern indicates an autoregressive term. You should use the partial autocorrelation function to determine the order of the autoregressive term.