In This Topic
Step 1: Determine whether each term in the model is significant
- P-value ≤ α: The term is statistically significant
- If the p-value is less than or equal to the significance level, you can conclude that the coefficient is statistically significant.
- P-value > α: The term is not statistically significant
- If the p-value is greater than the significance level, you cannot conclude that the coefficient is statistically significant. You may want to refit the model without the term.
Final Estimates of Parameters
| Type | Coef | SE Coef | T-Value | P-Value |
|---|---|---|---|---|
| AR 1 | -0.504 | 0.114 | -4.42 | 0.000 |
| Constant | 150.415 | 0.325 | 463.34 | 0.000 |
| Mean | 100.000 | 0.216 |
Key Results: P, Coef
The autoregressive term has a p-value that is less than the significance level of 0.05. You can conclude that the coefficient for the autoregressive term is statistically significant, and you should keep the term in the model.
Step 2: Determine how well the model fits the data
Use the mean square error (MS) to determine how well the model fits the data. Smaller values indicate a better fitting model.
Residual Sums of Squares
| DF | SS | MS |
|---|---|---|
| 58 | 366.733 | 6.32299 |
Key Results: MS
The mean square error is 6.323 for this model. This value is not very informative by itself, but you can use it to compare the fits of different ARIMA models.
Step 3: Determine whether your model meets the assumptions of the analysis
- Ljung-Box chi-square statistics
- To determine whether the residuals are independent, compare the p-value to the significance level for each chi square statistic. Usually, a significance level (denoted as α or alpha) of 0.05 works well. If the p-value is greater than the significance level, you can conclude that the residuals are independent and that the model meets the assumption.
- Autocorrelation function of the residuals
- If no significant correlations are present, you can conclude that the residuals are independent. However, you may see 1 or 2 significant correlations at higher order lags that are not seasonal lags. These correlations are usually caused by random error instead and are not a sign that the assumption is not met. In this case, you can conclude that the residuals are independent.
- Partial autocorrelation function of the residuals
- If no significant correlations are present, you can conclude that the residuals are independent. However, you may see 1 or 2 significant correlations at higher order lags that are not seasonal lags. These correlations are usually caused by random error instead and are not a sign that the assumption is not met. In this case, you can conclude that the residuals are independent.
Modified Box-Pierce (Ljung-Box) Chi-Square Statistic
| Lag | 12 | 24 | 36 | 48 |
|---|---|---|---|---|
| Chi-Square | 4.05 | 12.13 | 25.62 | 32.09 |
| DF | 10 | 22 | 34 | 46 |
| P-Value | 0.945 | 0.955 | 0.849 | 0.940 |
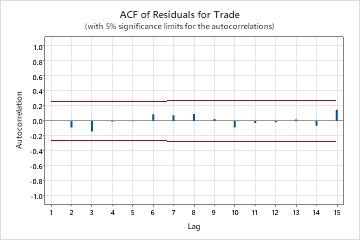
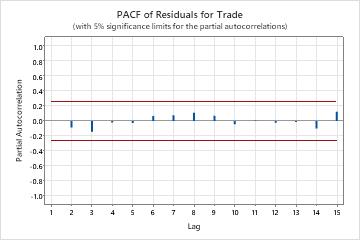
Key Results: P-Value, ACF of Residuals, PACF of residuals
In these results, the p-values for the Ljung-Box chi-square statistics are all greater than 0.05. None of the correlations for the autocorrelation function of the residuals or the partial autocorrelation function of the residuals are significant. You can conclude that the model meets the assumption that the residuals are independent.