In This Topic
Summary of current warranty claims
After reformatting the data with Pre-Process Warranty Data, the data are interval censored, grouped in intervals of the form (t0, t1), (t1, t2),...,(tk-1, tk) such that each interval (ti-1, ti) contains ni failures (if ti is finite) or ni suspensions (if ti is infinite), i = 1, 2,..., k.
Total number of units = the total number of units shipped up to the present time
Observed number of failures = the number of shipped units that failed during the warranty period


Number of units at risk for future time periods = the total number of right censored units under warranty
Notation
| Term | Description |
|---|---|
| R(t) | the reliability function |
Note
For more information on the reliability function, go to Survival probabilities.
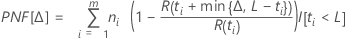
Predicted future failures
Calculations for the expected number of future failures are based only on "suspended units" (right-censored units). Units that have already failed have no impact on future failures.
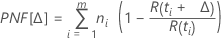


Notation
| Term | Description |
|---|---|
| ti | the suspension times |
| ni | the number of units suspended at time ti, i = 1, 2,...,m |
| m | the number of distinct suspension times |
| R(t) | the reliability function. For more information, go to Survival probabilities |
Confidence intervals for the expected number of failures
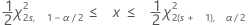

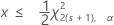
These confidence intervals and bounds are based on the assumption that failures occur according to an approximate Poisson process with a constant rate.
Notation
| Term | Description |
|---|---|
| s | calculated predicted number of failures (the statistic) |
| x | true predicted number of failures (the parameter) |
 | the 100(1-α)th percentile of the chi-square distribution with f degrees of freedom |
| α | the level of significance (alpha) |
Graphs
- Predicted Number of Failures Plot
- The predicted number of failures are plotted against future time periods. The range of the x-axis is the range of future time periods. If you do not specify future time periods (that is, if the PREDICT subcommand is not given), the range of the x-axis is (0, 5].
- Predicted Cost of Failures Plot
- If you specify an average cost per failure (that is, if you use the COST subcommand), the predicted cost of failures are plotted against future time periods. The range of the x-axis is the range of future time periods. If you do not specify future time periods (that is, if the PREDICT subcommand is not given), the range of the x-axis is (0, 5].