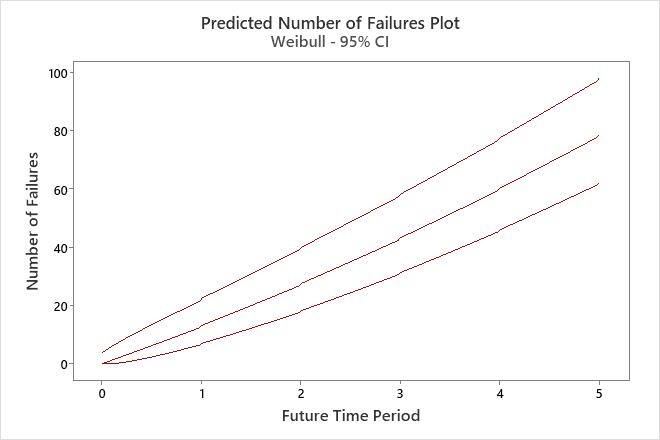
The Predicted Number of Failures Plot displays the number of additional failures that the model predicts from the end of the data collection period through the corresponding future time.
Additional shipments at each time provide more failure opportunities, which causes a slight, abrupt increase in the number of failures shown at the beginning of each new time period.
You can also display the 95% confidence intervals for the predicted number of failures, as shown in the plot in this example.
Example output
Interpretation
For the compressor data, the engineer can be 95% confident that approximately 62 to 98 units will fail in the next 5 months.