A reliability engineer wants to predict warranty claims that are caused by defective refrigerator compressors. The engineer collects and analyzes monthly failure data for the previous year.
The engineer knows that the future production schedule is for 1000 units to be shipped each month. The failure data can be modeled using a Weibull distribution. After reformatting the pre-process warranty data, the engineer uses warranty prediction to forecast future warranty claims.
- Open the sample data, CompressorFailures_preprocess.MWX.
- Choose .
- In Start time, enter Start time.
- In End time, enter End time.
- In Frequency (optional), enter Frequencies.
- Click Prediction. In Production quantity for each time period, enter 1000.
- Click OK in each dialog box.
Interpret the results
The results in the Summary of Current Warranty Claims table indicate that, of the 12,000 compressors in the field during the data collection period, 69 compressors failed. Based on the estimate obtained using a Weibull distribution, approximately 69 compressors were expected to fail during this time.
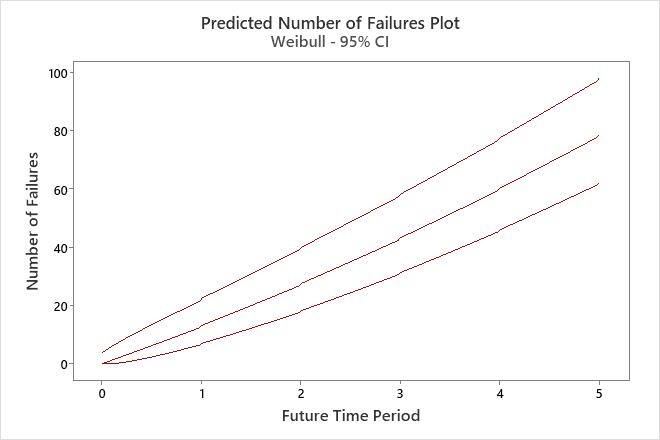
Using the Table of Predicted Number of Failures and the Predicted Number of Failures Plot, the engineer can conclude with 95% confidence that the number of additional compressors that are expected to fail within the next five months is within the interval from approximately 62 to 98 compressors.
Distribution Parameters
| Distribution | Shape | Scale |
|---|---|---|
| Weibull | 1.26494 | 398.062 |
Summary of Current Warranty Claims
| Total number of units | 12000 |
|---|---|
| Observed number of failures | 69 |
| Expected number of failures | 68.5201 |
| 95% Poisson CI | (53.2630, 86.7876) |
| Number of units at risk for future time periods | 11931 |
Production Schedule
| Future time period | 1 | 2 | 3 | 4 | 5 |
|---|---|---|---|---|---|
| Production quantity | 1000 | 1000 | 1000 | 1000 | 1000 |
Table of Predicted Number of Failures
| Future Time Period | Potential Number of Failures | Predicted Number of Failures | ||
|---|---|---|---|---|
| 95% Poisson CI | ||||
| Lower | Upper | |||
| 1 | 12931 | 13.1073 | 7.0000 | 22.3660 |
| 2 | 13931 | 27.4930 | 18.1933 | 39.8678 |
| 3 | 14931 | 43.1798 | 31.2722 | 58.1271 |
| 4 | 15931 | 60.1892 | 45.9516 | 77.4449 |
| 5 | 16931 | 78.5416 | 62.1373 | 97.9488 |