Use the probability plot for the Cox-Snell residuals to determine the following:
- Whether the distribution assumption is appropriate
- Whether the assumption of equal shape (for the Weibull or the exponential distributions) or scale parameter (for other distributions) is appropriate
The probability plot for the Cox-Snell residuals combines the data to calculate one fitted line, which helps you more easily determine whether the plotted points follow the fitted line closely. If the plotted points follow the fitted line closely, then the assumptions are appropriate. If the plotted points do not follow the fitted line, then either or both assumptions might be violated.
Example output
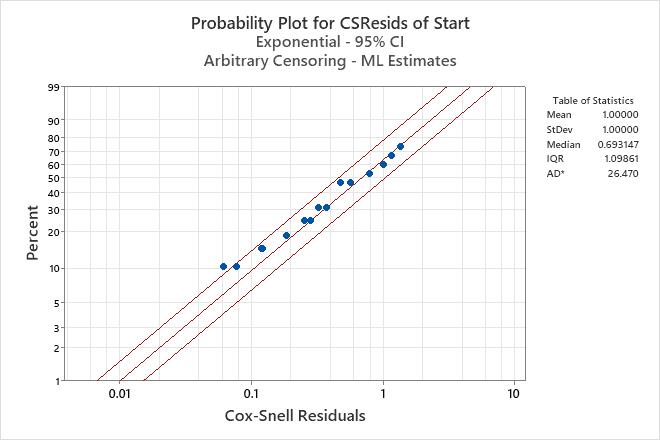
Interpretation
For the compressor case data, the plotted points follow the fitted line, except for one point. The plot suggests that the assumptions are appropriate, but the engineers should investigate why the one point is farther from the fitted line than the others.