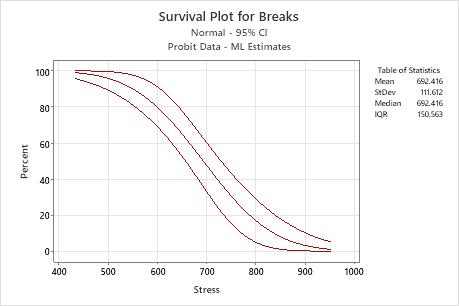
The survival plot is a graphical display of the estimated probit regression equation.
- The middle line on the graph represents the percent of units that can withstand an impact at a given level of stress. When you hold your pointer over the curve, Minitab displays the survival probability and level of stress.
- The upper and lower limits show an approximate 95% confidence interval for the percent of units that can withstand an impact at a given level of stress.
This graph will always show a decreasing function because survival probability (also known as reliability) always decreases with an increase in stress.
Example output
Interpretation
In this survival plot for the windshield data, approximately 65% of all windshields would survive an impact at 650 mph. Also, 95% of the time, in repeated tests, the engineer can expect that the percentage of windshields that would survive an impact of 650 mph would fall between approximately 52.4% and 77.6%.