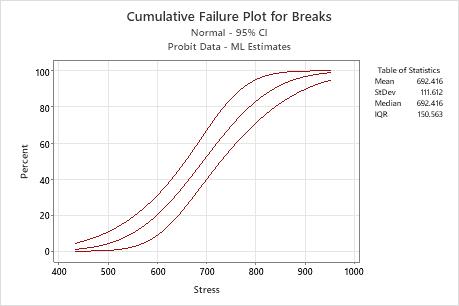
To describe product reliability in terms of when the product fails, the cumulative failure plot displays the cumulative probability that an item fails at stresses less than or equal to the given level of stress. The cumulative failure function represents 1 − survival function.
- The middle line is the estimated cumulative failure. When you hold your pointer over the curve, Minitab displays the cumulative failure probability and level of stress.
- The upper and lower limits show an approximate 95% confidence interval for the percent of units that cannot withstand an impact at a given level of stress.
Example output
Interpretation
For the windshield data, the probability that a windshield will have broken by the time the velocity reaches 830 mph is approximately 0.90. In other words, you can expect approximately 90% of windshields to fail at a velocity of 830 mph.