An engineer of aircraft windshields wants to investigate how well the windshields can withstand projectile impacts at a range of velocities. The engineer subjects a random sample of windshields to projectiles at one of eight velocities and records whether the windshields withstood the impact.
The engineer performs probit analysis to determine the range of velocities at which a certain percentage of the windshields will break when subjected to the projectile impact.
- Open the sample data, WindshieldStress.MWX.
- Choose .
- Select Response in event/trial format.
- In Number of events, enter Breaks.
- In Number of trials, enter N.
- In Stress (stimulus), enter Stress.
- From Assumed distribution, select Normal.
- Click OK.
Interpret the results
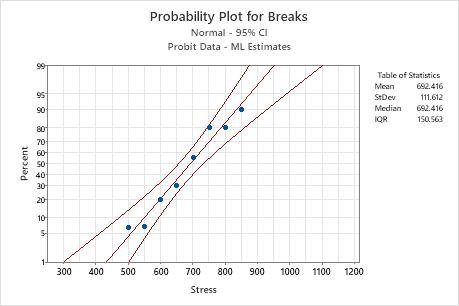
To evaluate the distribution fit, the engineer uses a significance level of 0.1. The goodness-of-fit p-values (0.977 and 0.975) are greater than the significance level, and the points on the probability plot fall along an approximate straight line. Therefore, the engineer can assume that the normal distribution model provides a good fit for the data.
To evaluate significant effects, the engineer uses a significance level of 0.05. Because the p-value for Stress (0.000) is less than the significance level (0.05), the engineer concludes that the velocity of the projectile does have a statistically significant effect on whether or not the windshield breaks.
The table of percentiles indicates that the engineer can be 95% confident that 1% of the windshields will fail at a velocity between 300.019 mph and 501.649 mph.
Response Information
| Variable | Value | Count |
|---|---|---|
| Breaks | Event | 37 |
| Non-event | 52 | |
| N | Total | 89 |
Regression Table
| Variable | Coef | Standard Error | Z | P |
|---|---|---|---|---|
| Constant | -6.20376 | 1.06565 | -5.82 | 0.000 |
| Stress | 0.0089596 | 0.0015615 | 5.74 | 0.000 |
| Natural | ||||
| Response | 0 |
Goodness-of-Fit Tests
| Method | Chi-Square | DF | P |
|---|---|---|---|
| Pearson | 1.19972 | 6 | 0.977 |
| Deviance | 1.22858 | 6 | 0.975 |
Parameter Estimates
| Standard Error | 95.0% Normal CI | |||
|---|---|---|---|---|
| Parameter | Estimate | Lower | Upper | |
| Mean | 692.416 | 18.3649 | 656.421 | 728.410 |
| StDev | 111.612 | 19.4518 | 79.3167 | 157.058 |
Table of Percentiles
| Standard Error | 95.0% Fiducial CI | |||
|---|---|---|---|---|
| Percent | Percentile | Lower | Upper | |
| 1 | 432.767 | 45.8542 | 300.019 | 501.649 |
| 2 | 463.192 | 41.0355 | 345.266 | 525.291 |
| 3 | 482.496 | 38.0450 | 373.838 | 540.427 |
| 4 | 497.018 | 35.8391 | 395.242 | 551.902 |
| 5 | 508.830 | 34.0781 | 412.585 | 561.304 |
| 6 | 518.884 | 32.6067 | 427.289 | 569.364 |
| 7 | 527.699 | 31.3403 | 440.133 | 576.480 |
| 8 | 535.592 | 30.2277 | 451.589 | 582.896 |
| 9 | 542.771 | 29.2352 | 461.967 | 588.771 |
| 10 | 549.379 | 28.3398 | 471.482 | 594.217 |
| 20 | 598.480 | 22.4304 | 540.595 | 636.280 |
| 30 | 633.886 | 19.4337 | 587.639 | 669.400 |
| 40 | 664.139 | 18.1881 | 624.815 | 700.723 |
| 50 | 692.416 | 18.3649 | 656.409 | 733.152 |
| 60 | 720.692 | 19.8068 | 685.039 | 768.545 |
| 70 | 750.945 | 22.4716 | 713.104 | 808.979 |
| 80 | 786.351 | 26.5977 | 743.723 | 858.524 |
| 90 | 835.453 | 33.3805 | 783.926 | 929.497 |
| 91 | 842.060 | 34.3538 | 789.210 | 939.174 |
| 92 | 849.239 | 35.4233 | 794.925 | 949.712 |
| 93 | 857.132 | 36.6126 | 801.183 | 961.326 |
| 94 | 865.948 | 37.9558 | 808.140 | 974.328 |
| 95 | 876.002 | 39.5048 | 816.041 | 989.192 |
| 96 | 887.814 | 41.3455 | 825.280 | 1006.70 |
| 97 | 902.335 | 43.6350 | 836.585 | 1028.27 |
| 98 | 921.639 | 46.7171 | 851.535 | 1057.03 |
| 99 | 952.065 | 51.6465 | 874.954 | 1102.50 |