This command converts raw warranty data into arbitrarily-censored data that is grouped in intervals. The data may be entered in one of two formats. Format A stores the shipment quantities and the resulting number of failures in columns. For example, the following table displays warranty data in Format A. The table indicates that 10,000 units were shipped in January; of these units, 50 failed in February, 60 failed in March, 100 failed in April, and 300 failed in May. Likewise, of the 15,000 units that were shipped in February, 78 failed in March, 130 failed in April, and 200 failed in May.
| Warranty data in Format A | |||||
|---|---|---|---|---|---|
| Return period: | |||||
| Shipping quantities: | February | March | April | May | |
| January | 10000 | 50 | 60 | 100 | 300 |
| February | 15000 | 78 | 130 | 200 | |
| March | 23000 | 275 | 600 | ||
| April | 32000 | 400 | |||
You can also enter warranty data in Format B, with the shipment values in the first row of the worksheet and the resulting number of failures in subsequent rows. The following table contains the same warranty data in Format B. Because the table has the same information as the table in Format A, its interpretation is the same.
| Warranty data in Format B | ||||
|---|---|---|---|---|
| Shipping quantities: | ||||
| January | February | March | April | |
| Return period: | 10000 | 15000 | 23000 | 32000 |
| 1 month later | 50 | 78 | 275 | 400 |
| 2 months later | 60 | 130 | 600 | |
| 3 months later | 100 | 200 | ||
| 4 months later | 300 | |||
The following algorithm for transforming the raw warranty data matrix to arbitrarily-censored data that is grouped in intervals applies directly to Format A. However, the algorithm can also be used with Format B because Format B can be converted to Format A using the following formula:
- A(i,j) = B( j,i), if j = 1
- A(i,j) = B( j – i+1, i), if j ≠ 1 and i < j 1 and i < j
where A is the matrix of warranty data under Format A and B is the matrix of warranty data under Format B.
Minitab transforms the warranty data under Format A to interval censored data as follows:
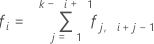
- The number of failures in the time interval (i-1, i), i = 1, 2,...,k, is given by:
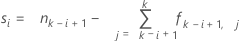
- The number of right censored units (units that have not yet failed) at time i is given by:
If missing values exist, replace each missing value row with a row of zeros and apply the formulas above. Also, if the frequency of an interval is zero because all cells involved in its calculation were reduced to zero due to this missing values rule, then the frequency is set to be missing.
Using the formulas, Minitab converts the original data into the following arbitrarily-censored data that is grouped in intervals.
| Start Time | End Time | Frequencies |
|---|---|---|
| 0 | 1 | 803 |
| 1 | 2 | 790 |
| 2 | 3 | 300 |
| 3 | 4 | 300 |
| 1 | * | 31600 |
| 2 | * | 22125 |
| 3 | * | 14592 |
| 4 | * | 9490 |
Notation
| Term | Description |
|---|---|
| fi, j | the number of items shipped at time period i that failed by time period j ; i = 1, 2,...,k and j = 1, 2,...,k |
| k | the total number of shipments |
| ni | the number of items shipped during time period i |