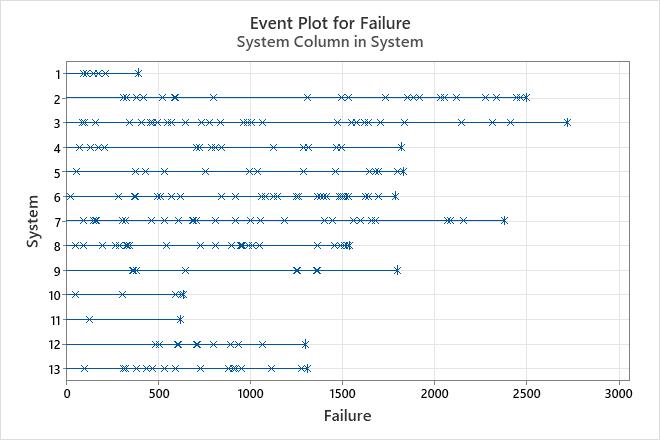
Use the event plot to compare systems and to determine whether successive failure rates are increasing, decreasing, or remaining constant. The event plot consists of the following:
- Horizontal lines that represent the lifetime of each system
- Data points that represent the failure and retirement times of each system
- Frequency values (if you provide a frequency column) that represent the frequency of failure at each time
Example output
Interpretation
For the air conditioning data, the event plot indicates the following:
- The first failure/repair occurred at approximately 20 days. System 1 was retired at approximately 400 days.
- The time between successive failures (or repairs) appears to be constant for all systems. The times between failures do not show an increasing or decreasing trend.