The Duane plot is a scatterplot of the cumulative failure rate versus time. Use a Duane plot to do the following:
- Assess whether your data follow a power-law process or a homogeneous Poisson process.
- Determine whether your system is improving, deteriorating, or remaining stable.
The fitted line on the Duane plot is the best fitted line when the assumption of the power-law process is valid and the shape and scale are estimated using the least squares method.
The Duane plot should be approximately linear if the power-law process or homogeneous Poisson process is appropriate. A negative slope shows reliability improvement, a positive slope shows reliability deterioration, and no slope (a horizontal line) shows a stable system.
Example output
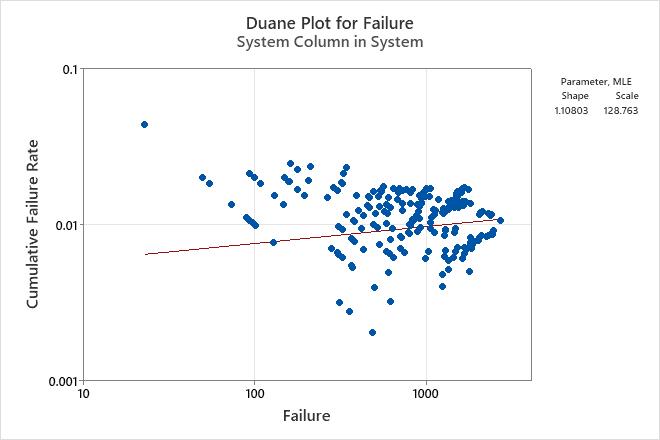
Interpretation
For the air conditioning data, an outlier appears at approximately 20 days. The data approximately follow a horizontal line, which indicates that the power-law process is an adequate model and that the system is relatively stable.