A reliability engineer assesses the failure rate of a specific air conditioning unit that is used in commercial jet planes. The engineer collects failure data for air conditioning units in 13 airplanes. Each time a unit failed, it was repaired and returned to service.
The engineer wants to determine whether the failure rate is increasing, decreasing, or remaining constant over time. For these data, no air conditioning units were retired from service. All the data are exact failure times.
- Open the sample data, AirConditionerReliability.MWX.
- Choose .
- Select Data are exact failure/retirement times.
- In Variables/Start variables, enter Failure.
- In System ID (optional), enter System.
- Click OK.
Interpret the results
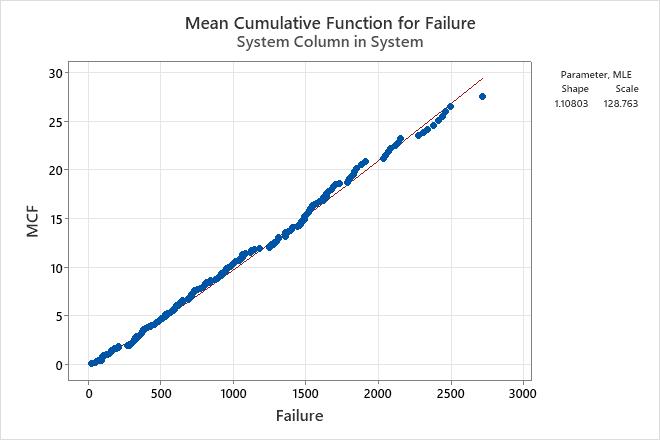
The estimate of the shape (1.10803) is close to 1, which indicates that the failure rate is nearly constant over time. The engineer can be 95% confident that the interval (0.984256, 1,24738) contains the actual shape of the distribution for the population.
The test for equal shape parameters indicates that there is not enough evidence to conclude that the systems come from populations with different shapes (P-Value = 0.539). Therefore, the engineer can assume that the pooled estimate for the shape is reasonable.
At an α-level of 0.05, none of the tests for trend are significant (P-Value = 0.107; P-Value = 0.448, P-Value = 0.388; P-Value = 0.688, P-Value = 0.389). Therefore, the engineer does not have evidence to reject the null hypothesis and conclude that a trend exists.
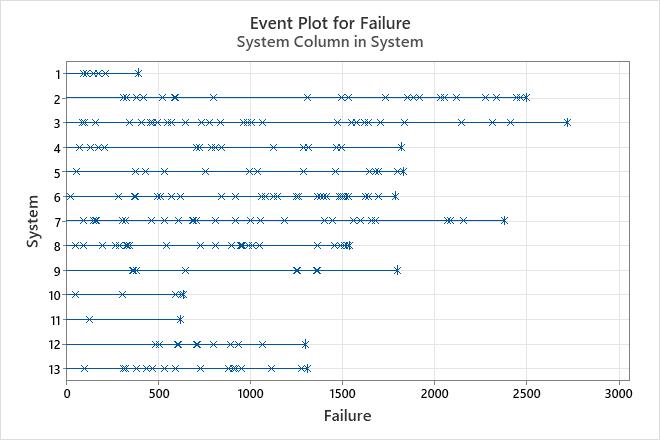
The event plot does not show a decreasing or increasing trend. The times between failures appear to be constant.
The plot of the mean cumulative function for failure shows a linear relationship, which also indicates that the rate of system failures is relatively constant.
Parameter Estimates
| Standard Error | 95% Normal CI | |||
|---|---|---|---|---|
| Parameter | Estimate | Lower | Upper | |
| Shape | 1.10803 | 0.067 | 0.984256 | 1.24738 |
| Scale | 128.763 | 22.489 | 91.4369 | 181.325 |
Test for Equal Shape Parameters
| Test Statistic | 10.88 |
|---|---|
| P-Value | 0.539 |
| DF | 12 |
Trend Tests
| MIL-Hdbk-189 | Laplace’s | ||||
|---|---|---|---|---|---|
| TTT-based | Pooled | TTT-based | Pooled | Anderson-Darling | |
| Test Statistic | 378.17 | 378.28 | 0.86 | -0.40 | 0.94 |
| P-Value | 0.107 | 0.448 | 0.388 | 0.688 | 0.389 |
| DF | 424 | 400 | |||