A reliability engineer studies the failure rates of engine windings of turbine assemblies to determine the times at which the windings fail. At high temperatures, the windings might decompose too fast.
- The times at which various percentages of the windings fail. The engineer is particularly interested in the 0.1th percentile
- The percentage of windings that will survive past 70 hours
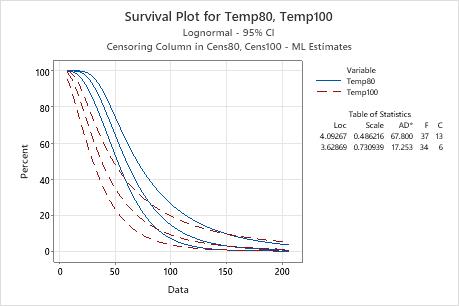
- The survival function for the engine windings (as shown on a survival plot)
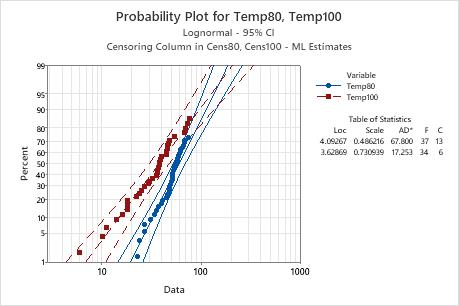
- The fit of the lognormal distribution for the data (as shown on a probability plot)
- Open the sample data, EngineWindingReliability.MWX.
- Choose .
- In Variables, enter Temp80 Temp100.
- From Assumed distribution, select Lognormal.
- Click Censor. Under Use censoring columns, enter Cens80 Cens100.
- In Censoring value, type 0. Click OK.
- Click Estimate. In Estimate percentiles for these additional percents, enter 0.1.
- In Estimate probabilities for these times (values), enter 70. Click OK.
- Click Graphs. Select Survival plot.
- Click OK in each dialog box.
Interpret the results
Using the Table of Percentiles, the engineer can determine the times at which various percentages of the windings fail. At 80° C, 1% of the windings to fail by 19.3281 hours. The values for the 0.1th percentile, which the engineer requested for the analysis, are also shown in the table. At 80° C, 0.1% of the windings fail by 13.3317 hours. At 100° C, 0.1% of the windings fail by 3.93505 hours. Therefore, the increase in temperature decreases the percentile by a value of approximately 9.5 hours.
Using the Table of Survival Probabilities, the engineer can determine what proportion of windings are expected to survive for more than 70 hours. At 80° C, 37.43% of the windings are expected to survive for more than 70 hours. At 100° C, 19.82% of the windings are expected to survive for more than 70 hours.
The engineer uses the survival plot to view the survival probabilities over time, and the probability plot to check that the lognormal distribution adequately fits the data.
- 80° C
- Variable: Temp80
Censoring
Censoring Information Count Uncensored value 37 Right censored value 13 Estimation Method: Maximum LikelihoodDistribution: LognormalParameter Estimates
Standard
Error95.0% Normal CI Parameter Estimate Lower Upper Location 4.09267 0.0719681 3.95161 4.23372 Scale 0.486216 0.0606247 0.380799 0.620816 Log-Likelihood = -181.625Goodness-of-Fit
Anderson-Darling
(Adjusted)67.800 Characteristics of Distribution
Standard
Error95.0% Normal CI Estimate Lower Upper Mean(MTTF) 67.4153 5.55245 57.3656 79.2255 Standard Deviation 34.8145 6.79827 23.7435 51.0476 Median 59.8995 4.31085 52.0192 68.9735 First Quartile(Q1) 43.1516 3.29526 37.1531 50.1186 Third Quartile(Q3) 83.1475 7.37690 69.8763 98.9392 Interquartile Range(IQR) 39.9959 6.33317 29.3245 54.5505 Table of Percentiles
Standard
Error95.0% Normal CI Percent Percentile Lower Upper 0.1 13.3317 2.51559 9.21026 19.2975 1 19.3281 2.83750 14.4953 25.7722 2 22.0674 2.92559 17.0178 28.6154 3 24.0034 2.97261 18.8304 30.5975 4 25.5709 3.00355 20.3126 32.1906 5 26.9212 3.02621 21.5978 33.5566 6 28.1265 3.04403 22.7506 34.7727 7 29.2276 3.05881 23.8074 35.8819 8 30.2501 3.07165 24.7910 36.9113 9 31.2110 3.08326 25.7170 37.8788 10 32.1225 3.09409 26.5962 38.7970 20 39.7837 3.20997 33.9646 46.5999 30 46.4184 3.41015 40.1936 53.6073 40 52.9573 3.75669 46.0833 60.8568 50 59.8995 4.31085 52.0192 68.9735 60 67.7517 5.15910 58.3584 78.6569 70 77.2958 6.45920 65.6184 91.0514 80 90.1863 8.58211 74.8412 108.678 90 111.696 12.8103 89.2100 139.849 91 114.958 13.5112 91.3052 144.738 92 118.610 14.3120 93.6288 150.255 93 122.759 15.2417 96.2426 156.581 94 127.565 16.3437 99.2372 163.979 95 133.276 17.6863 102.753 172.866 96 140.314 19.3873 107.026 183.955 97 149.477 21.6739 112.500 198.608 98 162.590 25.0764 120.175 219.977 99 185.634 31.3868 133.271 258.570 Table of Survival Probabilities
95.0% Normal CI Time Probability Lower Upper 70 0.374299 0.263102 0.497141 - 100° C
- Variable: Temp100
Censoring
Censoring Information Count Uncensored value 34 Right censored value 6 Estimation Method: Maximum LikelihoodDistribution: LognormalParameter Estimates
Standard
Error95.0% Normal CI Parameter Estimate Lower Upper Location 3.62869 0.117785 3.39784 3.85955 Scale 0.730939 0.0919808 0.571172 0.935397 Log-Likelihood = -160.688Goodness-of-Fit
Anderson-Darling
(Adjusted)17.253 Characteristics of Distribution
Standard
Error95.0% Normal CI Estimate Lower Upper Mean(MTTF) 49.1969 6.91761 37.3465 64.8076 Standard Deviation 41.3431 11.0416 24.4947 69.7806 Median 37.6636 4.43620 29.8995 47.4439 First Quartile(Q1) 23.0044 2.95055 17.8910 29.5791 Third Quartile(Q3) 61.6643 8.49843 47.0677 80.7876 Interquartile Range(IQR) 38.6600 7.24495 26.7759 55.8185 Table of Percentiles
Standard
Error95.0% Normal CI Percent Percentile Lower Upper 0.1 3.93505 1.17289 2.19401 7.05767 1 6.87764 1.61698 4.33827 10.9034 2 8.39410 1.79420 5.52121 12.7619 3 9.52528 1.91113 6.42827 14.1144 4 10.4756 2.00146 7.20360 15.2338 5 11.3181 2.07658 7.89954 16.2162 6 12.0884 2.14187 8.54184 17.1076 7 12.8069 2.20031 9.14535 17.9343 8 13.4863 2.25376 9.71949 18.7129 9 14.1354 2.30344 10.2707 19.4544 10 14.7606 2.35025 10.8036 20.1667 20 20.3589 2.75256 15.6197 26.5362 30 25.6717 3.16619 20.1592 32.6916 40 31.2967 3.69496 24.8316 39.4451 50 37.6636 4.43620 29.8995 47.4439 60 45.3258 5.53158 35.6832 57.5740 70 55.2572 7.24447 42.7359 71.4473 80 69.6769 10.2054 52.2896 92.8456 90 96.1040 16.6968 68.3686 135.091 91 100.354 17.8420 70.8271 142.191 92 105.185 19.1727 73.5864 150.351 93 110.765 20.7464 76.7308 159.894 94 117.347 22.6502 80.3853 171.305 95 125.334 25.0242 84.7457 185.362 96 135.414 28.1141 90.1452 203.417 97 148.925 32.4050 97.2189 228.130 98 168.993 39.0628 107.427 265.843 99 206.255 52.1976 125.600 338.704 Table of Survival Probabilities
95.0% Normal CI Time Probability Lower Upper 70 0.198233 0.107187 0.324816