A reliability engineer wants to assess the reliability of a new type of muffler and to estimate the proportion of warranty claims that can be expected with a 50,000-mile warranty. The engineer collects failure data on both the old type and the new type of mufflers. Mufflers were inspected for failure every 10,000 miles.
- The mileage at which various percentages of the mufflers fail
- The percentage of mufflers that will survive past 50,000 miles
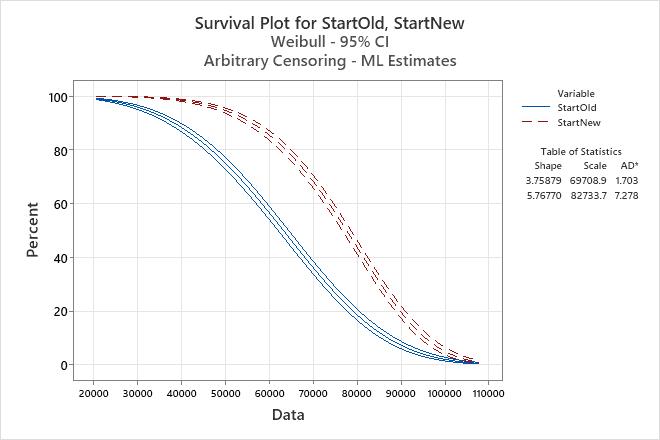
- The survival function for the mufflers (as shown on a survival plot)
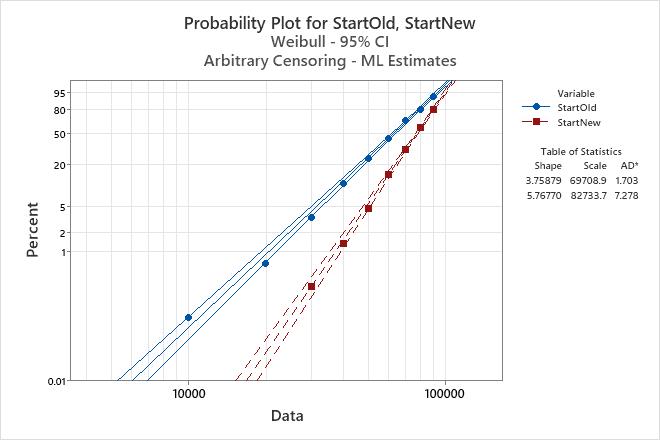
- The fit of the Weibull distribution for the data (as shown on a probability plot)
- Open the sample data, MufflerReliability.MWX.
- Choose .
- In Start variables, enter StartOld StartNew.
- In End variables, enter EndOld EndNew.
- In Frequency columns (optional), enter FreqOld FreqNew.
- From Assumed distribution, select Weibull.
- Click Estimate. In Estimate probabilities for these times (values), enter 50000. Click OK.
- Click Graphs. Select Survival plot.
- Click OK in each dialog box.
Interpret the results
Using the Table of Percentiles, the engineer can determine the mileage at which various percentages of the old mufflers and new mufflers fail. For the old mufflers, 10% of the mufflers fail by 38,307 miles. For the new mufflers, 10% of the mufflers to fail by 56,006.1 miles.
Using the Table of Survival Probabilities, the engineer can determine what proportion of the mufflers are expected to survive at least 50,000 miles. For the old mufflers, the probability of surviving past 50,000 miles is approximately 75.07%. For the new mufflers, the probability of surviving past 50,000 miles is approximately 94.67%.
The engineer uses the survival plot to view the survival probabilities at different mileages, and the probability plot to check that the Weibull distribution adequately fits the data.
- Old Mufflers
- Variable Start: StartOld End: EndOldFrequency: FreqOld
Censoring
Censoring Information Count Right censored value 83 Interval censored value 965 Left censored value 1 Estimation Method: Maximum LikelihoodDistribution: WeibullParameter Estimates
Standard
Error95.0% Normal CI Parameter Estimate Lower Upper Shape 3.75879 0.100226 3.56739 3.96045 Scale 69708.9 618.000 68508.1 70930.7 Log-Likelihood = -2083.927Goodness-of-Fit
Anderson-Darling
(Adjusted)1.703 Characteristics of Distribution
Standard
Error95.0% Normal CI Estimate Lower Upper Mean(MTTF) 62963.8 585.834 61826.0 64122.5 Standard Deviation 18685.0 417.812 17883.8 19522.1 Median 63232.6 618.048 62032.7 64455.6 First Quartile(Q1) 50042.1 692.162 48703.7 51417.3 Third Quartile(Q3) 76037.5 658.037 74758.6 77338.2 Interquartile Range(IQR) 25995.4 610.478 24826.0 27219.9 Table of Percentiles
Standard
Error95.0% Normal CI Percent Percentile Lower Upper 1 20501.3 730.973 19117.5 21985.2 2 24686.2 762.138 23236.7 26226.0 3 27535.4 773.441 26060.5 29093.8 4 29766.4 777.507 28280.8 31329.9 5 31630.7 778.040 30141.9 33193.0 6 33249.1 776.589 31761.3 34806.5 7 34689.8 773.926 33205.6 36240.3 8 35995.3 770.488 34516.4 37537.6 9 37194.3 766.537 35721.9 38727.5 10 38307.0 762.243 36841.8 39830.5 20 46771.7 714.662 45391.8 48193.6 30 52987.5 671.735 51687.1 54320.5 40 58301.0 638.544 57062.8 59566.1 50 63232.6 618.048 62032.7 64455.6 60 68106.3 614.500 66912.5 69321.4 70 73237.9 634.997 72003.8 74493.1 80 79117.5 693.244 77770.3 80487.9 90 87026.8 827.620 85419.8 88664.1 91 88068.9 849.547 86419.5 89749.8 92 89195.0 874.226 87497.9 90925.0 93 90425.9 902.323 88674.6 92211.8 94 91791.7 934.808 89977.7 93642.3 95 93338.0 973.162 91450.0 95265.0 96 95139.2 1019.83 93161.2 97159.2 97 97330.7 1079.31 95238.2 99469.3 98 100206 1161.47 97954.9 102508 99 104650 1296.79 102139 107223 Table of Survival Probabilities
95.0% Normal CI Time Probability Lower Upper 50000 0.750682 0.727911 0.771856 - New Mufflers
- Variable Start: StartNew End: EndNewFrequency: FreqNew
Censoring
Censoring Information Count Right censored value 210 Interval censored value 839 Estimation Method: Maximum LikelihoodDistribution: WeibullParameter Estimates
Standard
Error95.0% Normal CI Parameter Estimate Lower Upper Shape 5.76770 0.174361 5.43589 6.11977 Scale 82733.7 501.285 81757.0 83722.0 Log-Likelihood = -1804.510Goodness-of-Fit
Anderson-Darling
(Adjusted)7.278 Characteristics of Distribution
Standard
Error95.0% Normal CI Estimate Lower Upper Mean(MTTF) 76585.0 488.710 75633.1 77548.8 Standard Deviation 15389.5 407.421 14611.4 16209.1 Median 77639.9 501.312 76663.5 78628.7 First Quartile(Q1) 66660.6 610.001 65475.7 67866.9 Third Quartile(Q3) 87554.2 543.215 86496.0 88625.4 Interquartile Range(IQR) 20893.7 591.844 19765.3 22086.5 Table of Percentiles
Standard
Error95.0% Normal CI Percent Percentile Lower Upper 1 37265.1 938.485 35470.3 39150.6 2 42060.6 910.590 40313.2 43883.7 3 45163.8 884.871 43462.4 46931.9 4 47516.0 861.886 45856.4 49235.7 5 49434.9 841.147 47813.5 51111.3 6 51068.9 822.219 49482.6 52706.1 7 52500.3 804.776 50946.5 54101.6 8 53779.7 788.572 52256.1 55347.7 9 54940.5 773.424 53445.3 56477.5 10 56006.1 759.186 54537.7 57514.0 20 63788.2 649.873 62527.1 65074.7 30 69192.0 576.979 68070.3 70332.1 40 73638.2 528.302 72609.9 74680.9 50 77639.9 501.312 76663.5 78628.7 60 81489.1 497.212 80520.4 82469.5 70 85439.7 519.747 84427.0 86464.5 80 89849.4 577.132 88725.4 90987.7 90 95605.5 695.279 94252.5 96978.0 91 96350.1 713.480 94961.8 97758.6 92 97151.1 733.704 95723.7 98599.9 93 98022.8 756.429 96551.4 99516.6 94 98985.2 782.340 97463.6 100530 95 100069 812.488 98488.8 101674 96 101323 848.595 99673.3 103000 97 102838 893.813 101101 104605 98 104808 955.006 102952 106696 99 107814 1053.11 105770 109898 Table of Survival Probabilities
95.0% Normal CI Time Probability Lower Upper 50000 0.946704 0.935996 0.955664