The mean cumulative function plot displays the mean cumulative function versus time. The plot is a step function with steps at system failures (repairs) or endpoints of intervals. Use this plot to determine whether your system is improving, deteriorating, or remaining constant.
The plot provides information about the pattern of system failures as follows:
- A linear function indicates that system failures are remaining constant over time.
- A curve that is concave down indicates that the time between failures is increasing over time. This pattern indicates that your system reliability is improving.
- A curve that is concave up indicates that the time between failures is decreasing over time. This pattern indicates that your system reliability is deteriorating.
You may want to set the minimum X-scale value to the time of the first failure so that you can more easily view the failure rate.
Example output
Interpretation
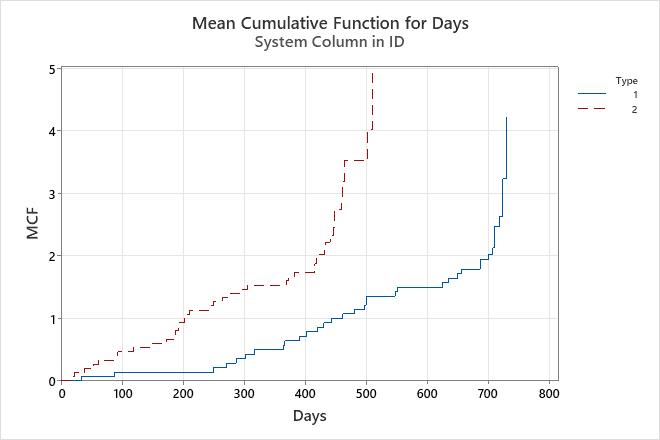
For the brake reliability data, the estimate of the mean cumulative function is shown for each type of brake component. Using the plot, the engineer concludes the following:
- The function that represents the type 2 brake component is relatively linear, not curved, up until approximately 450 days. Therefore, the failure rate for the type 2 brake component is relatively constant until 450 days.
- The function that represents the type 1 brake component is linear from approximately 200 days through 700 days, and then increases rapidly. Therefore, the failure rate for the type 1 brake component is fairly constant until 700 days, then increases rapidly.
- The function that represents the type 1 brake component is to the right of the function that represents the type 2 brake component. Therefore, failures occur less often for the type 1 brake component than for the type 2 brake component.