The mean cumulative difference function plot displays the mean cumulative difference function versus time. The plot is a step function with steps at system failures (repairs) or endpoints of intervals. Use this plot to compare the mean cumulative functions across different groups.
The plot provides information about how the cumulative number of repairs averaged over systems compares for two groups over time.
You may want to set the minimum X-scale value to the time of the first failure so that you can more easily view the mean cumulative difference.
Example output
Interpretation
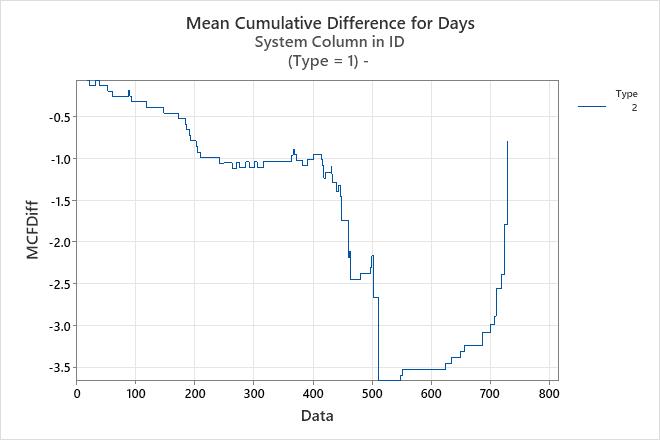
For the brake reliability data, the magnitude of the mean cumulative difference becomes increasingly large until approximately 500 days, when the type 2 brake component is retired. At approximately 500 days, when all systems were retired for the type 2 brake component, the difference between the number of repairs between the two type of brake components is approximately −3.5 repairs, which indicates an average of approximately 3.5 more repairs for the type 2 component than for the type 1 component.