Use the event plot to compare systems and to determine whether successive failures are increasing, decreasing, or remaining constant. The event plot consists of the following:
- Horizontal lines that represent the lifetime of each system
- Data points that represent the failure and retirement times of each system
- Cost or frequency values (if you provide a cost/frequency column) that represent the cost or frequency of failure at each time
Example output
Interpretation
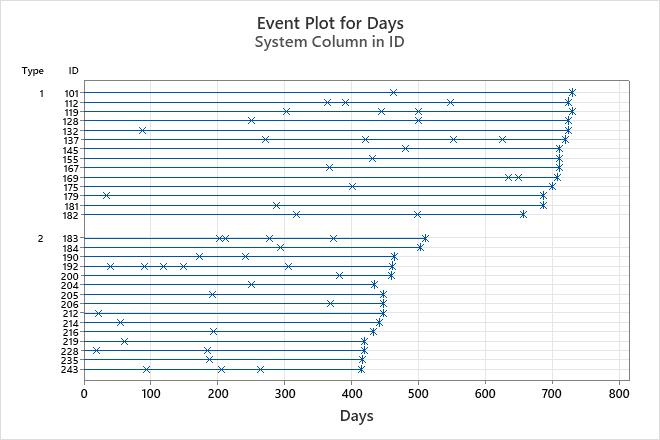
For the brake reliability data, the event plot shows the following:
- The first failure/repair occurred at approximately 20 days. For the type 1 brake component, all systems were retired by 730 days. For the type 2 brake component, most systems were retired by 500 days.
- The time between successive failures (or repairs) appears to be fairly constant for all systems after failures begin to occur
- A higher percentage of early failures occur for the type 2 brake component than for the type 1 brake component.