A reliability engineer wants to compare the failure rate for two different types of a brake component that is used on subway trains. The engineer collects replacement time data and component type for 29 trains. Each time a unit failed, it was repaired and returned to service.
The engineer uses a nonparametric growth curve to evaluate the data without assuming a distribution model. For these data, no brake components were retired from service. Therefore, all the data are exact failure times.
- Open the sample data, BrakeReliability.MWX.
- Choose .
- In Variables/Start variables, enter Days.
- Under System Information, select System ID, and then enter ID.
- Select By variable, and then enter Type.
- Click OK.
Interpret the results
Minitab displays nonparametric estimates of the mean cumulative function and its corresponding standard error and confidence limits separately for each group. For example, for the type 1 brake component, the mean cumulative function at 650 days is 1.71429. That is, the mean cumulative number of repairs at 650 days, averaged over all the systems, is approximately 1.7. The engineer can be 95% confident that the true mean cumulative function for the type 1 component at 650 days is contained within the interval 1.27912 and 2.29750.
The engineer uses the mean cumulative difference function to make comparisons across groups. For example, at 500 days, the type 2 brake component had, on average, 2.16420 more failures than the type 1 brake component. The engineer can be 95% confident that, at 500 days, true mean cumulative difference (type 1 – type 2) is contained within the interval −3.23488 and −1.09352.
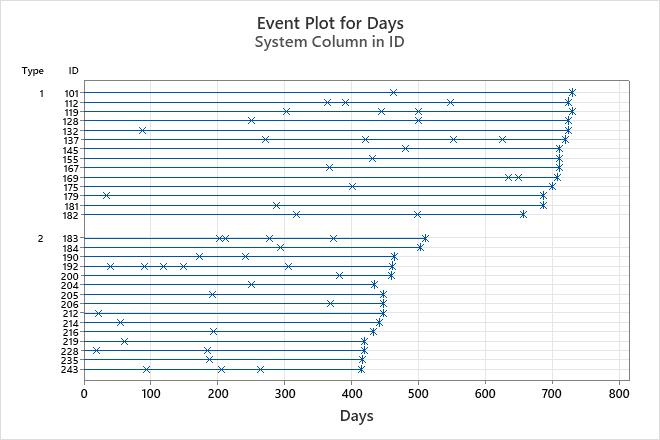
The event plot shows when the failures occurred for each system. Each line extends to the final day of observation. The plot also shows trends within and across groups. In this plot, system failures generally occur at a constant rate. At 200 days, there are many more failures for the type 2 brake component than the type 1 brake component.
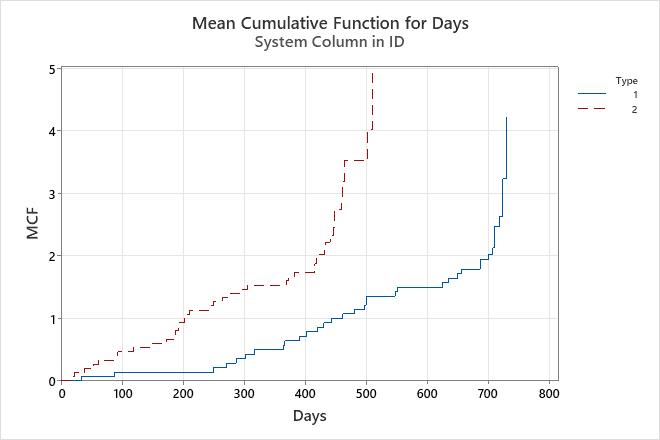
- The function that represents the type 2 brake component is relatively linear, not curved, up until approximately 450 days. Therefore, the failure rate for the type 2 brake component is relatively constant until 450 days.
- The function that represents the type 1 brake component is linear from approximately 200 days through 700 days, and then increases rapidly. Therefore, the failure rate for the type 1 brake component is fairly constant until 700 days, then increases rapidly.
- The function that represents the type 1 brake component is to the right of the function that represents the type 2 brake component. Therefore, failures occur less often for the type 1 brake component than for the type 2 brake component.
- Type 1
- System: IDNonparametric Estimates
Table of Mean Cumulative Function
Mean
Cumulative
FunctionStandard
Error95% Normal CI Time Lower Upper System 33 0.07143 0.068830 0.01081 0.47218 179 88 0.14286 0.093522 0.03960 0.51540 132 250 0.21429 0.109664 0.07859 0.58426 128 272 0.28571 0.120736 0.12481 0.65408 137 287 0.35714 0.128060 0.17686 0.72120 181 302 0.42857 0.132260 0.23407 0.78471 119 317 0.50000 0.133631 0.29613 0.84423 182 364 0.57143 0.132260 0.36303 0.89945 112 367 0.64286 0.128060 0.43506 0.94990 167 391 0.71429 0.157421 0.46374 1.10019 112 402 0.78571 0.149098 0.54168 1.13970 175 421 0.85714 0.170747 0.58008 1.26653 137 431 0.92857 0.158574 0.66444 1.29771 155 444 1.00000 0.174964 0.70969 1.40906 119 462 1.07143 0.158574 0.80165 1.43200 101 481 1.14286 0.137661 0.90253 1.44718 145 498 1.21429 0.149098 0.95456 1.54468 182 500 1.28571 0.187044 0.96675 1.70992 119 500 1.35714 0.191853 1.02872 1.79042 128 548 1.42857 0.219328 1.05735 1.93013 112 552 1.50000 0.242226 1.09304 2.05848 137 625 1.57143 0.280566 1.10744 2.22982 137 635 1.64286 0.259653 1.20522 2.23940 169 650 1.71429 0.256120 1.27912 2.29750 169 657 1.78571 0.270649 1.32679 2.40338 182 687 1.86264 0.266655 1.40692 2.46596 179 687 1.93956 0.260862 1.49012 2.52456 181 700 2.03047 0.254826 1.58771 2.59671 175 708 2.13047 0.274527 1.65498 2.74258 169 710 2.24158 0.268755 1.77214 2.83537 145 710 2.35269 0.257586 1.89833 2.91581 155 710 2.46380 0.240267 2.03516 2.98273 167 719 2.63047 0.347216 2.03084 3.40714 137 724 2.83047 0.425594 2.10800 3.80055 112 724 3.03047 0.443994 2.27405 4.03849 128 724 3.23047 0.410559 2.51818 4.14424 132 730 3.73047 0.471307 2.91221 4.77864 101 730 4.23047 0.410559 3.49769 5.11677 119 - Type 2
- System: IDNonparametric Estimates
Table of Mean Cumulative Function
Mean
Cumulative
FunctionStandard
Error95% Normal CI Time Lower Upper System 19 0.06667 0.064406 0.01004 0.44284 228 22 0.13333 0.087771 0.03670 0.48447 212 39 0.20000 0.103280 0.07269 0.55029 192 54 0.26667 0.114180 0.11521 0.61721 214 61 0.33333 0.121716 0.16295 0.68186 219 91 0.40000 0.157762 0.18465 0.86652 192 93 0.46667 0.159629 0.23869 0.91237 243 119 0.53333 0.207989 0.24834 1.14538 192 148 0.60000 0.263312 0.25386 1.41809 192 173 0.66667 0.261052 0.30945 1.43622 190 185 0.73333 0.274334 0.35227 1.52661 228 187 0.80000 0.269979 0.41289 1.55006 235 192 0.86667 0.264435 0.47658 1.57604 205 194 0.93333 0.257624 0.54335 1.60321 216 203 1.00000 0.249444 0.61330 1.63052 183 205 1.06667 0.257624 0.66442 1.71243 243 211 1.13333 0.264435 0.71738 1.79046 183 242 1.20000 0.269979 0.77210 1.86504 190 250 1.26667 0.257624 0.85023 1.88706 204 264 1.33333 0.277555 0.88664 2.00507 243 277 1.40000 0.295146 0.92615 2.11630 183 293 1.46667 0.280740 1.00786 2.13434 184 306 1.53333 0.324779 1.01238 2.32237 192 369 1.60000 0.309839 1.09468 2.33859 206 373 1.66667 0.335548 1.12325 2.47298 183 382 1.73333 0.319258 1.20810 2.48693 200 415 1.80000 0.342540 1.23962 2.61370 243 416 1.87143 0.340512 1.31007 2.67333 235 419 1.94835 0.338097 1.38662 2.73764 219 419 2.02527 0.349310 1.44435 2.83985 228 432 2.11618 0.347441 1.53391 2.91948 216 434 2.21618 0.345034 1.63337 3.00696 204 441 2.32729 0.341839 1.74512 3.10369 214 447 2.45229 0.337430 1.87262 3.21141 212 448 2.59515 0.331033 2.02109 3.33227 205 448 2.73801 0.315398 2.18466 3.43152 206 460 2.93801 0.298009 2.40832 3.58420 200 461 3.18801 0.449834 2.41776 4.20364 192 464 3.52134 0.511478 2.64893 4.68108 190 503 4.02134 0.535360 3.09778 5.22025 184 511 5.02134 0.535360 4.07443 6.18831 183 - Comparison: (Type = 1) - (Type = 2)
Table of Mean Cumulative Difference Function
Mean Cumulative
Difference
FunctionStandard
Error95% Normal CI Time Lower Upper 19 -0.06667 0.064406 -0.19290 0.05957 22 -0.13333 0.087771 -0.30536 0.03869 33 -0.06190 0.111541 -0.28052 0.15671 39 -0.12857 0.124114 -0.37183 0.11469 54 -0.19524 0.133322 -0.45654 0.06607 61 -0.26190 0.139830 -0.53597 0.01216 88 -0.19048 0.153496 -0.49132 0.11037 91 -0.25714 0.183399 -0.61660 0.10231 93 -0.32381 0.185008 -0.68642 0.03880 119 -0.39048 0.228047 -0.83744 0.05649 148 -0.45714 0.279427 -1.00481 0.09052 173 -0.52381 0.277299 -1.06730 0.01969 185 -0.59048 0.289837 -1.15855 -0.02241 187 -0.65714 0.285719 -1.21714 -0.09714 192 -0.72381 0.280486 -1.27355 -0.17407 194 -0.79048 0.274074 -1.32765 -0.25330 203 -0.85714 0.266399 -1.37928 -0.33501 205 -0.92381 0.274074 -1.46099 -0.38663 211 -0.99048 0.280486 -1.54022 -0.44073 242 -1.05714 0.285719 -1.61714 -0.49714 250 -1.05238 0.279994 -1.60116 -0.50360 264 -1.11905 0.298435 -1.70397 -0.53413 272 -1.04762 0.302679 -1.64086 -0.45438 277 -1.11429 0.318886 -1.73929 -0.48928 287 -1.04286 0.321731 -1.67344 -0.41228 293 -1.10952 0.308568 -1.71431 -0.50474 302 -1.03810 0.310335 -1.64634 -0.42985 306 -1.10476 0.350677 -1.79208 -0.41745 317 -1.03333 0.351196 -1.72166 -0.34500 364 -0.96190 0.350677 -1.64922 -0.27459 367 -0.89048 0.349114 -1.57473 -0.20622 369 -0.95714 0.335260 -1.61424 -0.30004 373 -1.02381 0.359155 -1.72774 -0.31988 382 -1.09048 0.343985 -1.76467 -0.41628 391 -1.01905 0.355960 -1.71672 -0.32138 402 -0.94762 0.352358 -1.63823 -0.25701 415 -1.01429 0.373582 -1.74649 -0.28208 416 -1.08571 0.371724 -1.81428 -0.35715 419 -1.23956 0.379800 -1.98395 -0.49517 421 -1.16813 0.388808 -1.93018 -0.40608 431 -1.09670 0.383618 -1.84858 -0.34482 432 -1.18761 0.381917 -1.93616 -0.43907 434 -1.28761 0.379729 -2.03187 -0.54336 441 -1.39872 0.376828 -2.13729 -0.66015 444 -1.32729 0.384013 -2.07995 -0.57464 447 -1.45229 0.380094 -2.19726 -0.70733 448 -1.73801 0.360677 -2.44492 -1.03109 460 -1.93801 0.345574 -2.61532 -1.26070 461 -2.18801 0.482663 -3.13401 -1.24201 462 -2.11658 0.476966 -3.05142 -1.18174 464 -2.44991 0.535496 -3.49947 -1.40036 481 -2.37849 0.529680 -3.41664 -1.34033 498 -2.30706 0.532767 -3.35126 -1.26285 500 -2.16420 0.546276 -3.23488 -1.09352 503 -2.66420 0.568698 -3.77883 -1.54957 511 -3.66420 0.568698 -4.77883 -2.54957 548 -3.59277 0.578546 -4.72670 -2.45884 552 -3.52134 0.587608 -4.67303 -2.36965 625 -3.44991 0.604423 -4.63456 -2.26527 635 -3.37849 0.595004 -4.54467 -2.21230 650 -3.30706 0.593471 -4.47024 -2.14387 657 -3.23563 0.599884 -4.41138 -2.05988 687 -3.08178 0.595533 -4.24900 -1.91456 700 -2.99087 0.592914 -4.15296 -1.82878 708 -2.89087 0.601644 -4.07007 -1.71167 710 -2.55754 0.586803 -3.70765 -1.40743 719 -2.39087 0.638098 -3.64152 -1.14022 724 -1.79087 0.674662 -3.11319 -0.46856 730 -0.79087 0.674662 -2.11319 0.53144