A reliability engineer studies the failure rates of engine windings of turbine assemblies to determine the times at which the windings fail. At high temperatures, the windings might decompose too fast.
- The times at which various percentages of the windings fail.
- The percentage of windings that will survive past various times.
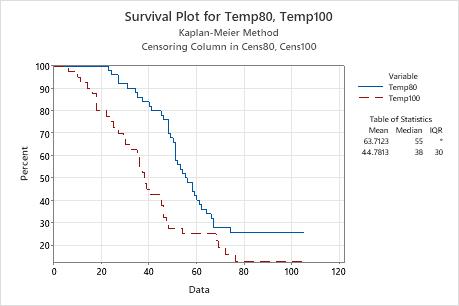
- The survival function for the engine windings (as shown on a survival plot).
- Whether the survival curves at the two temperatures are significantly different.
- Open the sample data, EngineWindingReliability.MWX.
- Choose .
- In Variables, enter Temp80 Temp100.
- Click Censor. Under Use censoring columns, enter Cens80 Cens100.
- In Censoring value, type 0. Click OK.
- Click Graphs. Select Survival plot.
- Click OK in each dialog box.
Interpret the results
The estimated median failure time for Temp80 is 55 hours and the estimated median failure time for Temp100 is 38 hours. Therefore, the increase in temperature decreases the median failure time by approximately 17 hours.
Minitab displays the survival estimates in the Kaplan-Meier Estimates table. At 80° C, 0.9000 (90%) of the windings survive past 31 hours. At 100° C, 0.9000 (90%) of the windings survive past 14 hours.
In the Test Statistics table, a p-value < α (usually, α = 0.05) indicates that the survival curves are significantly different. In this case, the both p-values (0.005 and 0.000) are less than α, which suggests that a change of 20° C has an effect on the breakdown of engine windings.
- 80° C
- Variable: Temp80
Censoring
Censoring Information Count Uncensored value 37 Right censored value 13 Nonparametric EstimatesCharacteristics of Variable
Standard
Error95.0% Normal CI Mean(MTTF) Lower Upper Q1 Median Q3 IQR 63.7123 3.83453 56.1968 71.2279 48 55 * * Kaplan-Meier Estimates
Number
at RiskNumber
FailedSurvival
ProbabilityStandard
Error95.0% Normal CI Time Lower Upper 23 50 1 0.980000 0.0197990 0.941195 1.00000 24 49 1 0.960000 0.0277128 0.905684 1.00000 27 48 2 0.920000 0.0383667 0.844803 0.99520 31 46 1 0.900000 0.0424264 0.816846 0.98315 34 45 1 0.880000 0.0459565 0.789927 0.97007 35 44 1 0.860000 0.0490714 0.763822 0.95618 37 43 1 0.840000 0.0518459 0.738384 0.94162 40 42 1 0.820000 0.0543323 0.713511 0.92649 41 41 1 0.800000 0.0565685 0.689128 0.91087 45 40 1 0.780000 0.0585833 0.665179 0.89482 46 39 1 0.760000 0.0603987 0.641621 0.87838 48 38 3 0.700000 0.0648074 0.572980 0.82702 49 35 1 0.680000 0.0659697 0.550702 0.80930 50 34 1 0.660000 0.0669925 0.528697 0.79130 51 33 4 0.580000 0.0697997 0.443195 0.71680 52 29 1 0.560000 0.0701997 0.422411 0.69759 53 28 1 0.540000 0.0704840 0.401854 0.67815 54 27 1 0.520000 0.0706541 0.381521 0.65848 55 26 1 0.500000 0.0707107 0.361410 0.63859 56 25 1 0.480000 0.0706541 0.341521 0.61848 58 24 2 0.440000 0.0701997 0.302411 0.57759 59 22 1 0.420000 0.0697997 0.283195 0.55680 60 21 1 0.400000 0.0692820 0.264210 0.53579 61 20 1 0.380000 0.0686440 0.245460 0.51454 62 19 1 0.360000 0.0678823 0.226953 0.49305 64 18 1 0.340000 0.0669925 0.208697 0.47130 66 17 1 0.320000 0.0659697 0.190702 0.44930 67 16 2 0.280000 0.0634980 0.155546 0.40445 74 13 1 0.258462 0.0621592 0.136632 0.38029 - 100° C
- Variable: Temp100
Censoring
Censoring Information Count Uncensored value 34 Right censored value 6 Nonparametric EstimatesCharacteristics of Variable
Standard
Error95.0% Normal CI Mean(MTTF) Lower Upper Q1 Median Q3 IQR 44.7813 4.43366 36.0914 53.4711 24 38 54 30 Kaplan-Meier Estimates
Number
at RiskNumber
FailedSurvival
ProbabilityStandard
Error95.0% Normal CI Time Lower Upper 6 40 1 0.97500 0.0246855 0.926617 1.00000 10 39 1 0.95000 0.0344601 0.882459 1.00000 11 38 1 0.92500 0.0416458 0.843376 1.00000 14 37 1 0.90000 0.0474342 0.807031 0.99297 16 36 1 0.87500 0.0522913 0.772511 0.97749 18 35 3 0.80000 0.0632456 0.676041 0.92396 22 32 1 0.77500 0.0660256 0.645592 0.90441 24 31 1 0.75000 0.0684653 0.615810 0.88419 25 30 1 0.72500 0.0706001 0.586626 0.86337 27 29 1 0.70000 0.0724569 0.557987 0.84201 29 28 1 0.67500 0.0740566 0.529852 0.82015 30 27 1 0.65000 0.0754155 0.502188 0.79781 32 26 1 0.62500 0.0765466 0.474972 0.77503 35 25 1 0.60000 0.0774597 0.448182 0.75182 36 24 2 0.55000 0.0786607 0.395828 0.70417 37 22 1 0.52500 0.0789581 0.370245 0.67975 38 21 2 0.47500 0.0789581 0.320245 0.62975 39 19 1 0.45000 0.0786607 0.295828 0.60417 40 18 1 0.42500 0.0781625 0.271804 0.57820 45 17 2 0.37500 0.0765466 0.224972 0.52503 46 15 2 0.32500 0.0740566 0.179852 0.47015 47 13 1 0.30000 0.0724569 0.157987 0.44201 48 12 1 0.27500 0.0706001 0.136626 0.41337 54 11 1 0.25000 0.0684653 0.115810 0.38419 68 8 1 0.21875 0.0666585 0.088102 0.34940 69 7 1 0.18750 0.0640434 0.061977 0.31302 72 6 1 0.15625 0.0605154 0.037642 0.27486 76 5 1 0.12500 0.0559017 0.015435 0.23457 - Comparison of Survival Curves
Test Statistics
Method Chi-Square DF P-Value Log-Rank 7.7152 1 0.005 Wilcoxon 13.1326 1 0.000