The survival function is located in the lower left corner of the distribution overview plot.
The survival plot depicts the probability that the item will survive until a particular time. Thus, the survival plot shows the reliability of the product over time. The Y-axis displays the probability of survival and the X-axis displays the reliability measurement (time, number of copies, miles driven).
When you hold your pointer over the survival curve, Minitab displays a table of times and survival probabilities.
Example output
Interpretation
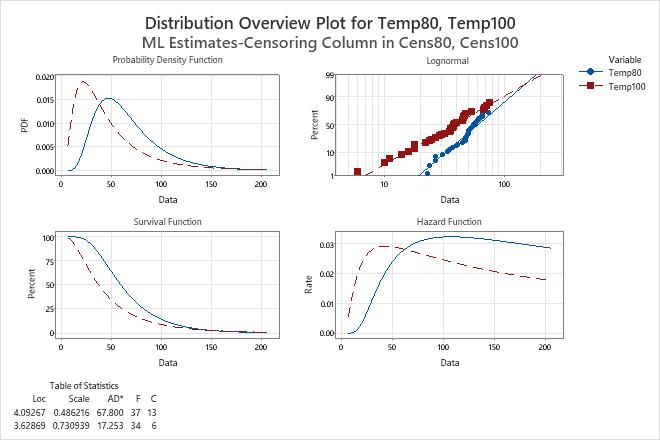
For the engine windings data, a survival function for each temperature variable is shown on the survival plot. At a temperature of 80° C, the probability of engine windings surviving at least 50 hours is 66%. At a temperature of 100° C, the probability of engine windings surviving at least 50 hours is about 36%. Both survival functions are based on a lognormal distribution.