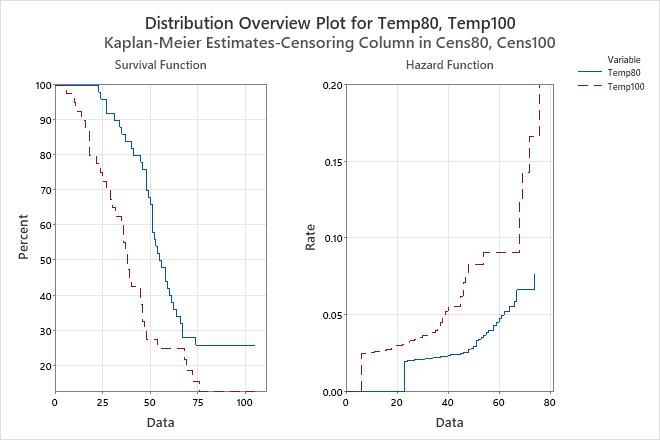
The survival plot depicts the probability that the item will survive until a particular time. Thus, the survival plot shows the reliability of the product over time. The Y-axis displays the probability of survival and the X-axis displays the reliability measurement (time, number of copies, miles driven).
When you do not select a distribution (when you choose to perform a nonparametric analysis), the survival plot is a step function with steps at the exact failure times. The function is calculated using the Kaplan-Meier method.
When you hold your pointer over each step, Minitab displays the probability of surviving (Y) until the plotted time (X).
Example output
Interpretation
For the engine windings data, a survival function for each temperature variable is shown on the survival plot. At a temperature of 80° C, the probability of engine windings surviving at least 50 hours is about 66%. At a temperature of 100° C, the probability of engine windings surviving at least 50 hours is about 27%.