The survival plot depicts the probability that the item will survive until a particular time. Thus, the survival plot shows the reliability of the product over time. The Y-axis displays the probability of survival and the X-axis displays the reliability measurement (time, number of copies, miles driven).
When you do not select a distribution (when you choose to perform a nonparametric analysis), the survival plot is a step function with steps at the endpoints of each interval. In this example, the survival function is calculated using the actuarial estimation method.
When you hold your pointer over each step, Minitab displays the probability of surviving (Y) until the time plotted (X).
Example output
Interpretation
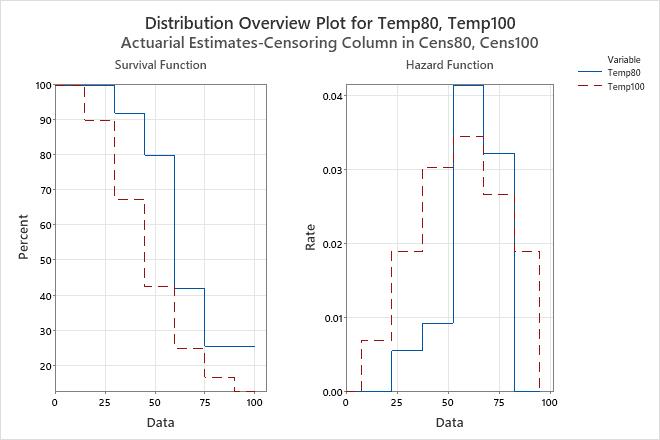
For the engine windings data, a survival function for each temperature variable is shown on the survival plot. At a temperature of 80° C, the probability of engine windings surviving at least 60 hours is 42%. At a temperature of 100° C, the probability of engine windings surviving at least 60 hours is 25%.